
Years most like 2022 did this almost without fail

Years just like 2022
The seasonal trends for many equity ETFs and indexes are about to turn from poor or neutral to positive as we enter the spring months. Seasonality alone, especially in stock indexes, is a shaky leg to stand on, but combined with other factors can be a helpful tool.
If we look at the year-to-date loss in the S&P 500 and compare it to other years, we can objectively find periods when poor returns and seasonality combined forces. We found 14 other years with more than a +0.7 correlation to this year (on a scale from -1.0 to +1.0).
Many of them bottomed right about where we did this year and typically carried higher into early summer. The 4 most recent years with high correlations are below. Out of all the precedents, only 1976 suffered an immediate rejection and lower lows.
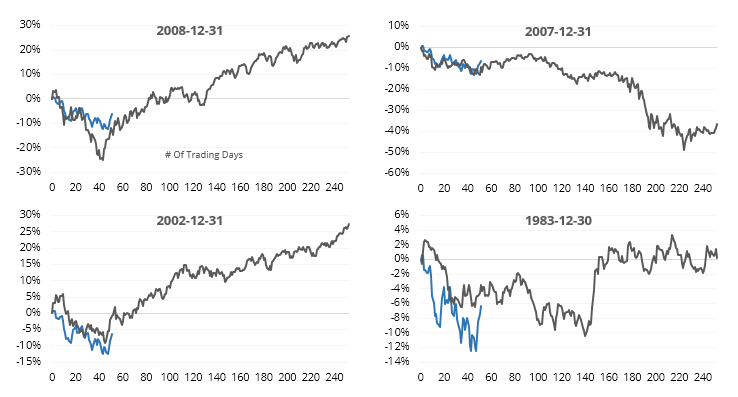
As always, we're more concerned with where we may be going instead of where we've been. Out of the 13 years with a YTD correlation greater than +0.70, 11 of them showed gains during the next 6 months. Median returns were significantly above random over the next 1-6 months.

A jump in technical buy signals
The number of S&P 500 members with a MACD indicator above zero has reversed higher. Dean noted that the reversal comes after a period where most stocks exhibited weak trend momentum.
The MACD indicator model identifies when the number of members with a MACD indicator above zero reverses from oversold to neutral in 15 sessions or fewer. The same model, with slightly different parameters, triggered a buy signal for the energy sector in early January.
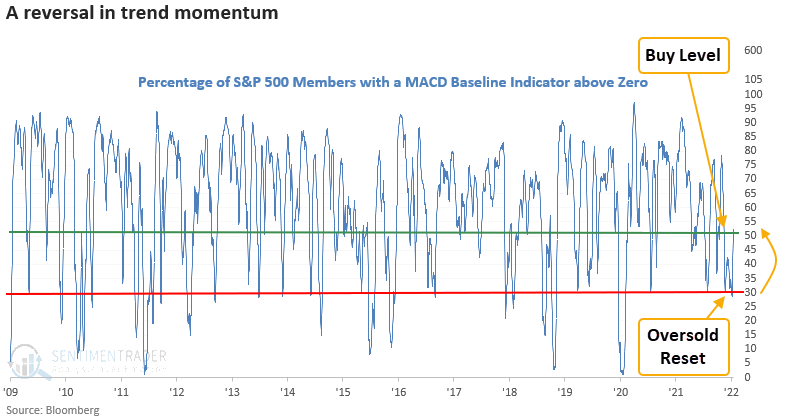
This signal triggered 46 other times over the past 32 years. After the others, S&P 500 future returns, win rates, and risk/reward profiles were solid across all time frames.
