Products
SentimenTrader Trading Tools
‍
Backtest Engine
My Trading Toolkit
Correlation Analysis
Seasonality
Market Prediction
Indicators & Data API
‍
Proprietary Indicators & Charts
Market Data API
Strategies & Scanner
‍
50+ Trading Strategies
Smart Stock Scanner
Smart Option Scanner
Research Reports
‍
Research Solutions
Reports Library
Free Resources
Simple Backtest Calculator
Simple Seasonality Calculator
The Kelly Criterion Calculator
Sentiment Geo Map
Public Research Reports
Education
Sentiment Indicators
Technical Indicators
Pricing
Company
About
In the News
Testimonials
Client Success Stories
Contact
Log inLoginSign up
< BACK TO ALL REPORTS

Worldwide markets, sectors, and industries all recover from bear markets

Jason Goepfert
2020-06-05
Across the globe, major indexes are recovering. Every major world market we follow fell into a bear market in March, now fewer than 15% of them are. We're seeing similar recoveries among major U.S. sectors and even industries. The only comparisons there were the ends of the last two bear markets.

Over the past few weeks, we've looked multiple times at the thrusts and recoveries not only in stocks and major indexes in the U.S., but also worldwide. It keeps going.

We've added a multitude of indicators in recent weeks to help monitor the health of industries, sectors, and worldwide markets, and they're starting to show meaningful changes in tone.

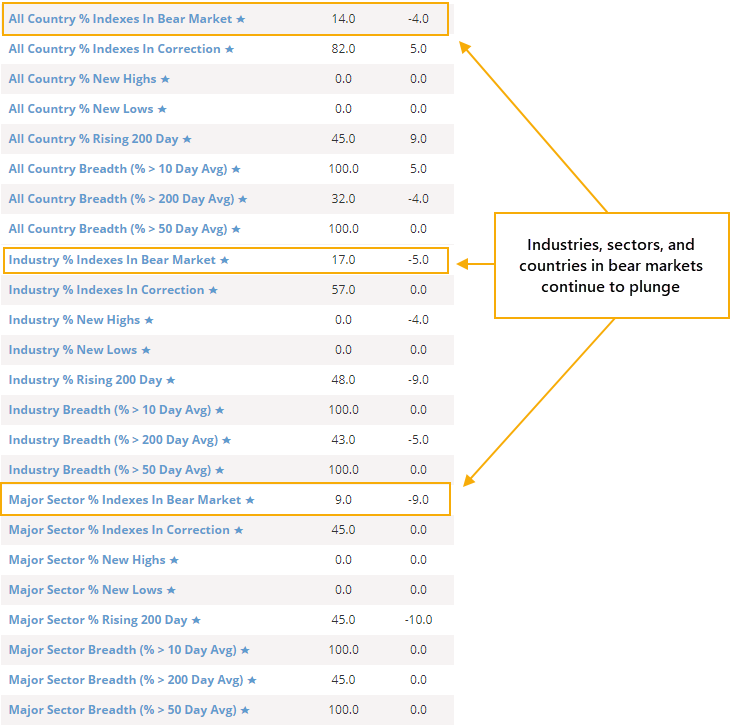
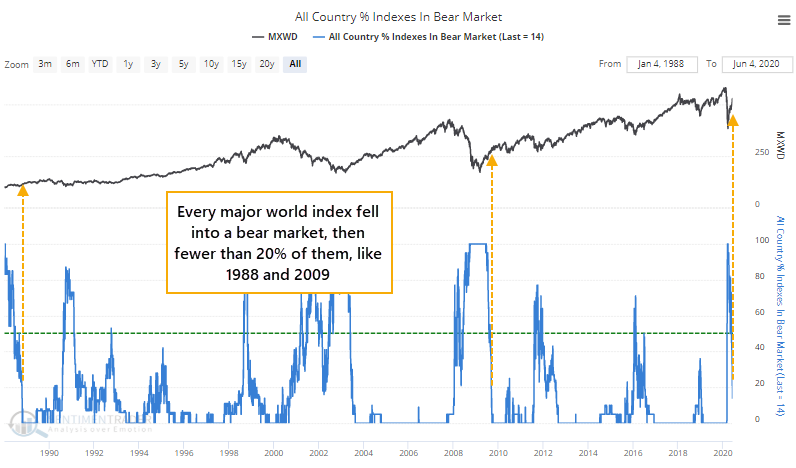
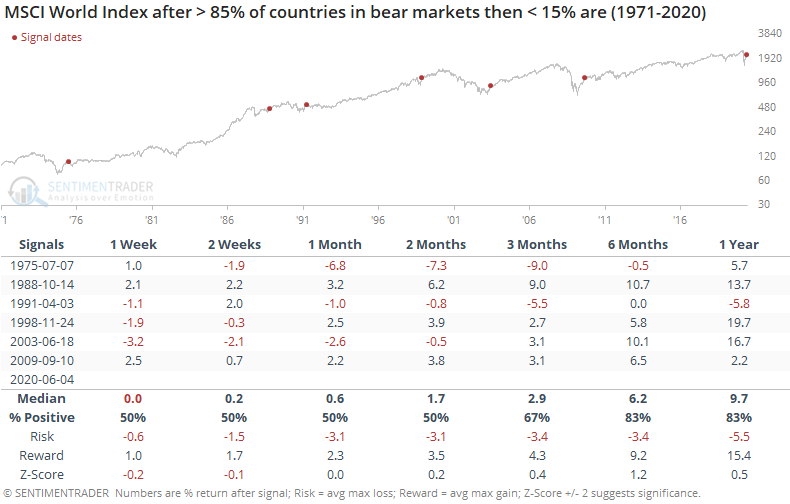
In March, every major world index we follow was in a bear market, and now fewer than 15% of them are. In recent decades, that only happened in 1988 and 2009.

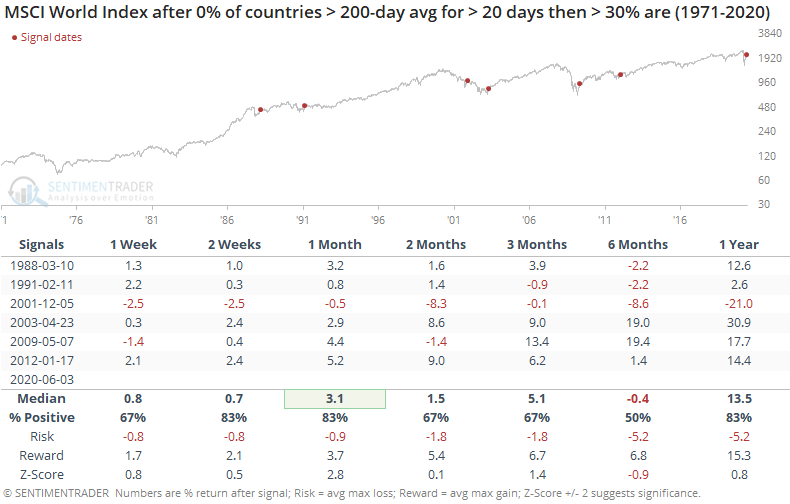
Overall, similar but less extreme recoveries preceded some choppy conditions for the MSCI World Index over the next couple of months, but they resolved higher over the next 6-12 months. All of them could be considered major recoveries.

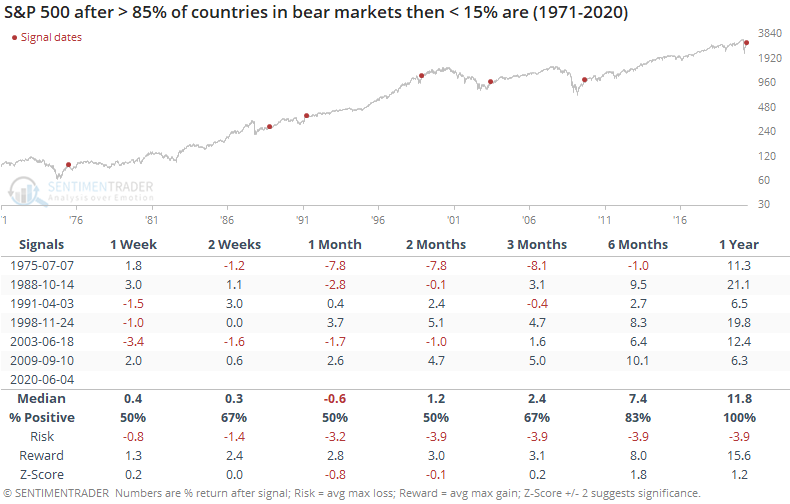
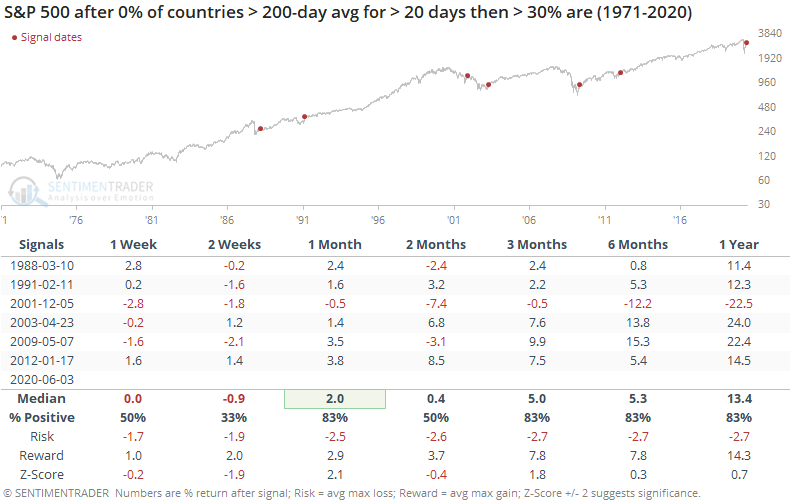
It was a good sign for domestic stocks, too. The S&P 500 was higher a year later every time.

Related but different, for more than 50 days, not a single major world index we follow managed to close above its 200-day average, and now more than 30% of them have. Again, mostly a good sign worldwide.

And domestically.

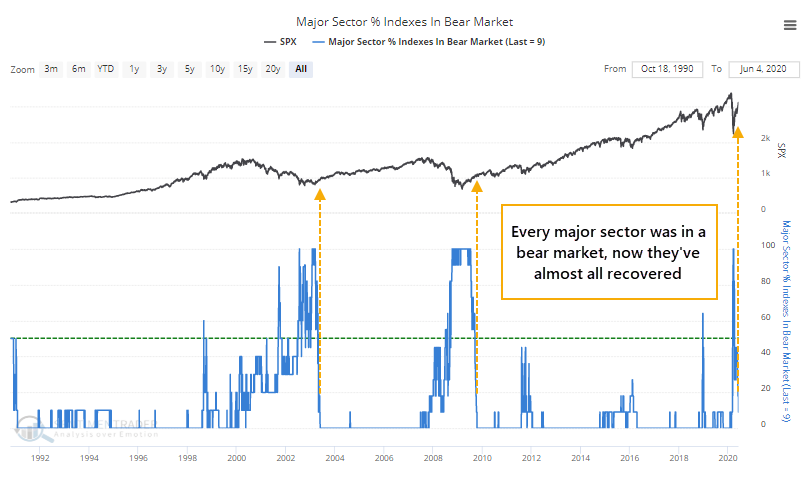
Among the 11 major U.S. sectors, all of them were in bear markets in March. Now, only one of them is. In the past 30 years, we've seen this kind of broad sector movement only at the ends of the last two protracted bear markets.

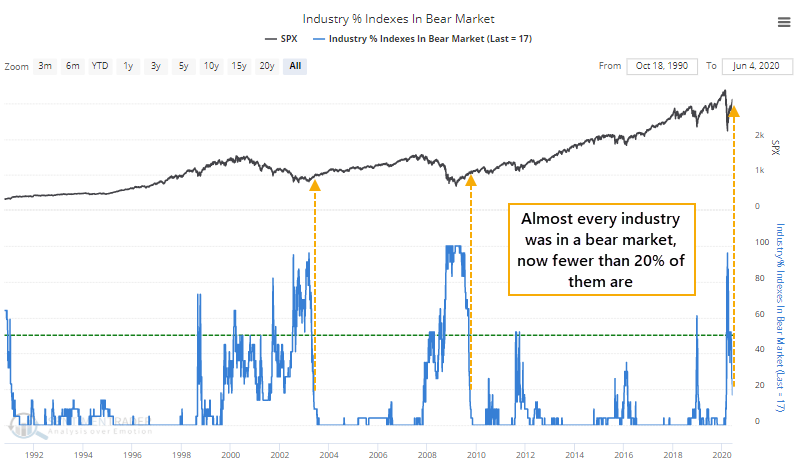
Drilling down to the U.S. industry level, almost every one of the 23 industries was in a bear market in March, now fewer than 20% of them are. This is quite a bit broader than the sector data, but with the same two precedents.

It's hard to compare what was basically a one-month bear market to the lasting devastation in 2001 and 2008, but the types of breadth readings witnessed each time is comparable. Maybe on a more compacted time frame, but similar severity. Like we saw with the thrusts and recoveries earlier this week, it's hard to ignore the positive long-term implications.

PRODUCTS
SentimenTrader
Trading Tools
Indicators & Data API
‍
Strategies & Scanner
‍
Research Reports
FREE
RESOUrCES
Simple Backtest
Calculator
Simple Seasonality
Calculator
The Kelly Criterion
Calculator
Sentiment Geo Map
‍
Public Research Reports
‍
Education
Sentiment Indicators
‍
Technical Indicators
‍
Pricing
Bundle pricing
‍
FAQ
‍
Announcements
‍
COMPANY
‍
About
‍
In the News
‍
Testimonials
‍
Client Success Stories
CONTACT
‍
General Inquiries
‍
Media Inquiries
‍
Financial Professionals Inquiries
‍
© 2026 Sundial Capital Research Inc. All rights reserved.
Setsail Marketing
TermsPrivacyAffiliate Program
Risk Disclosure: The information and tools provided are for research and analytical purposes only and are not intended as investment advice. Market analysis involves uncertainty, and outcomes may differ from expectations. Users should conduct their own due diligence and consider their individual circumstances before making any financial decisions. Past performance is not necessarily indicative of future results.

Hypothetical Performance Disclosure: Hypothetical performance results have many inherent limitations, some of which are described below. No representation is being made that any account will or is likely to achieve profits or losses similar to those shown; in fact, there are frequently sharp differences between hypothetical performance results and the actual results subsequently achieved by any particular trading program. One of the limitations of hypothetical performance results is that they are generally prepared with the benefit of hindsight. In addition, hypothetical trading does not involve financial risk, and no hypothetical trading record can completely account for the impact of financial risk of actual trading. for example, the ability to withstand losses or to adhere to a particular trading program in spite of trading losses are material points which can also adversely affect actual trading results. There are numerous other factors related to the markets in general or to the implementation of any specific trading program which cannot be fully accounted for in the preparation of hypothetical performance results and all which can adversely affect trading results.

Testimonial Disclosure: Testimonials appearing on this website may not be representative of other clients or customers and is not a guarantee of future performance or success.