
Will Santa's sleigh carry gold miners again?

Key points
- Most investors have heard reference to the "Santa Claus Rally" in stocks
- Gold-related stocks have also enjoyed a boost during a specific late-year seasonal window
- The favorable period is starting soon
The Santa Claus Miner rally
Most of us know that stocks have a seasonal tailwind around this time of year. Less known is that gold-related stocks have enjoyed consistent gains, as well.
As I define it, the Santa Claus Gold Miner Rally period:
- Begins on the close of the 11th trading day of December and;
- Extends through the close on the first trading day of January in the New Year
For 2023, this period extends from the close on December 15 through the close on January 2 of next year.
The data we will use
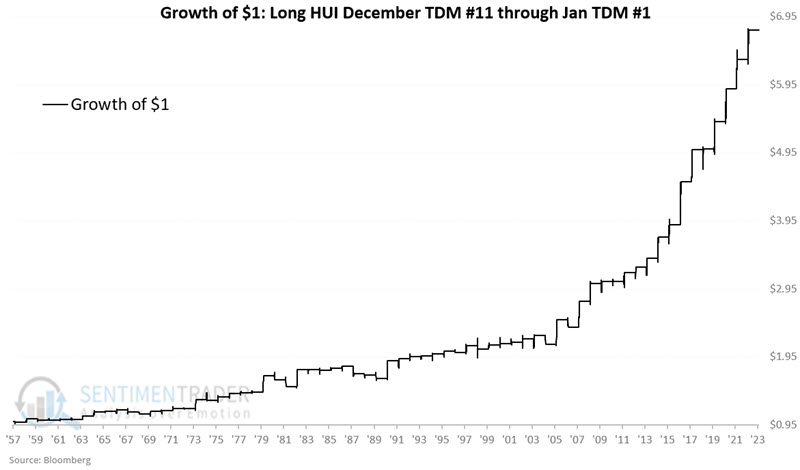
To test the longest possible history, we will use the Gold Bugs Index (ticker HUI), which we have data from 1957. The chart below displays the growth of $1 invested in HUI only from the close of December Trading Day of Month (TDM) #11 through January TDM #1.
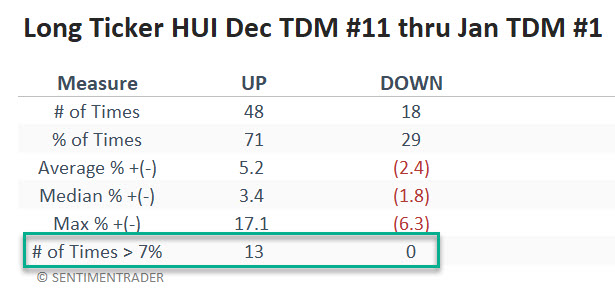
The table below summarizes HUI's performance during this late-year seasonal window. Note that big moves of 7% or more have all skewed to the positive side.
An important point to ponder
Through 1990, HUI showed a gain during this seasonal window 20 out of 33 years or 61% of the time. Since then, the Win Rate has improved dramatically. Since 1990, HUI has shown a gain in 28 out of 33 years or 85% of the time - including each of the last 12 years. This suggests one of two possibilities: Either this seasonal window has become more reliable, or we may be due for a reversion to the mean. There is no way to predict how this will play out in the future. In any event, it does suggest that this opportunity be treated as a purely speculative play and that capital allocations be conservative.
GDX as a trading vehicle
Ticker HUI is an index and cannot be traded directly. The Vaneck Gold Miners ETF (ticker GDX) is an exchange-traded fund that tracks an index of gold mining stocks, thus offering traders a direct way to play the sector. GDX began trading in 2006. Per Vaneck:
GDX seeks to replicate as closely as possible, before fees and expenses, the price and yield performance of the NYSE Arca Gold Miners Index (GDMNTR), which is intended to track the overall performance of companies involved in the gold mining industry.
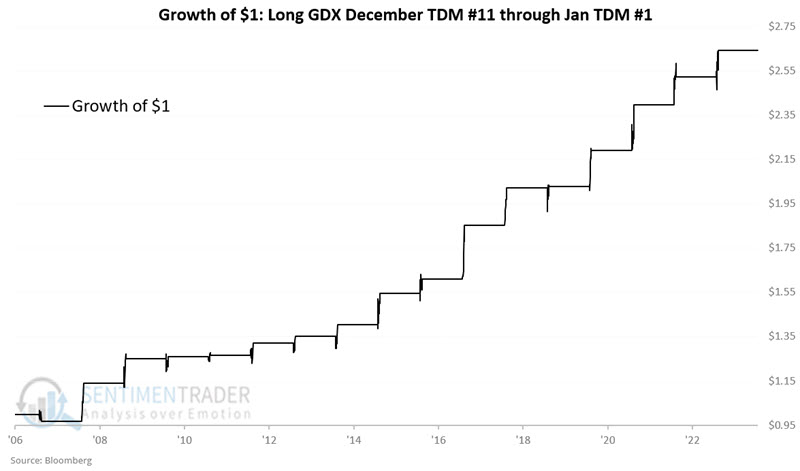
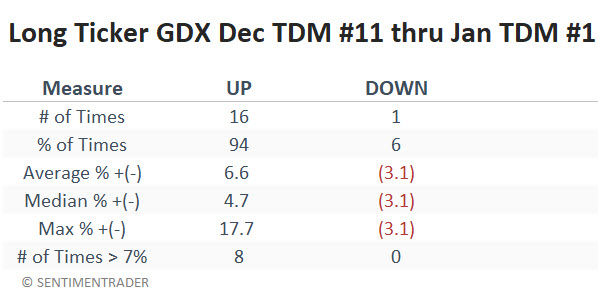
During the December 2006-January 2007 window, GDX lost -3.1%. Since then, it has rattled off 16 consecutive Santa Miner Rally gains. The chart and table below display GDX performance during this favorable window since inception.
What the research tells us…
The good news is that gold stocks have shown a reliable long-term tendency to rally during the latter part of December. Over 66 years, gold stocks have shown a gain in 7 out of 10 years. The one potential concern is that results have been almost "too good" in recent years, with GDX up 16 times in a row. The message is not necessarily to "avoid gold stocks this time because they might be overdue for a down year." After all, realistically, one could have made that argument after eight years in a row, or 9, etc. - and many opportunities would have been missed. The correct message is probably to treat this as a speculative opportunity with a conservative position size - and remember not to take it personally if a loss is incurred occasionally.