
Will QQQ Reassert Leadership or Has the Tide Turned?

In the stock market, favored styles come and go. A lot of people don't believe that right now. In fact, at any given point in time, a lot of people don't believe that. Because unfortunately - human nature being what it is - many investors fall into the trap of thinking that whatever is leading right now is "the new champion" - and that resistance is futile. And - here is the tricky part - to a point, and for a time, they can be correct.
A "trend" in the market - any trend - can and often will last for a long period of time. Hence the reason trend-following is favored by many investors and traders ("Hi, my name is Jay"). But then there is the other tricky part - the stark reality that NO trend ever lasts forever. And knowing when to stay with a trend or to walk away from a trend is one of the things that separates the big winners from everyone else.
Which seems like a good time to invoke...
Jay's Trading Maxim #28: Follow the trend, but DO NOT fall in love with the trend.
This one is especially true today.
THE RECENT PAST
In the past 5 to 10 years, there is little argument that the categories of large-cap, growth, momentum, and technology have ruled the roost. The Nasdaq 100 has been a superstar among stock indexes. And anyone who recognized these trends and got on board and stayed onboard has done very well for themselves. Those who tried to fade these trends have been left far behind.
But this leads to two important questions:
- Will these current trends last forever? (Hint: Not a chance!)
- If not, when will these trends change? (Hint: As I said, it gets tricky)
The stock market's history definitively answers the first question - i.e., nothing ever lasts - or leads - forever. So, let's focus on trying to develop a reasonable way to address the second question.
MEASURING ONE PLAY VERSUS ANOTHER
For testing purposes, we are going to use the following indexes:
- Russell 2000 Value Index - i.e., small-cap value stocks
- Russell 1000 Growth Index - i.e., large-cap growth stocks
I chose these indexes because a) they are broadly based, b) they are very different in terms of the types of stocks they hold, and c) I have data going back to 1979, and I'd like to run as long a test as possible.
The chart below displays the cumulative % growth for the two indexes From January 1979 through June 2021.
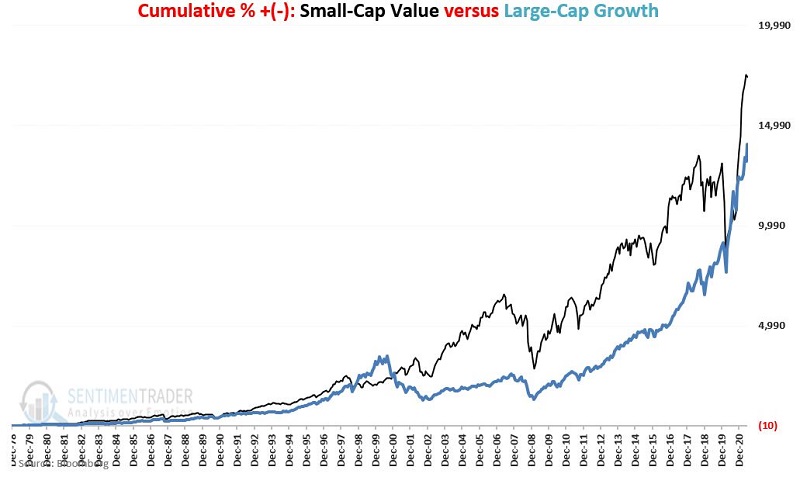
Given the massive outperformance of large-cap growth stocks in recent years, many investors are surprised to learn that over the past 42.5 years, small-cap value has outperformed:
- Small-Cap Value return = +17,408%
- Large-Cap Growth return = +14,049%
So, does this mean that small-cap value is "better" and that we should pay no attention to what has transpired in recent years? As I said, it can be a little tricky. The trick is recognizing, acknowledging, and being willing to act upon the knowledge that there is a "back-and-forth" to this relationship.
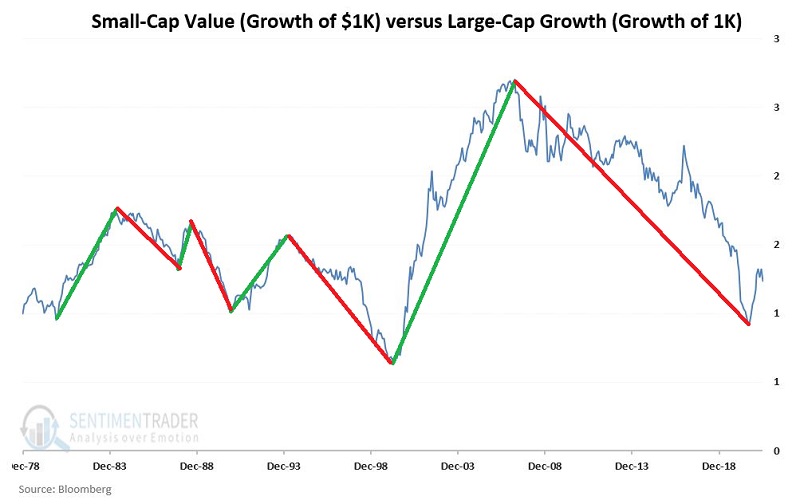
The chart below divides the growth of $1,000 invested in small-cap value divided by $1,000 invested in large-cap value since 1979. The aforementioned back-and-forth nature of this relationship that I alluded to previously becomes fairly obvious.
APPLYING THIS KNOWLEDGE
To try to take advantage of this relationship, we will use the following calculations:
- A = Each month, divide the growth of $1K in small-cap value by the growth of $1K in large-cap growth (see chart above)
- B = Keep a 10-month exponential moving average of A
- C = (A - B)
Then we will apply the following rules:
- If C > 0, it suggests that small-cap value is "leading," so we will hold the Russell 2000 Value Index
- If C < 0, it suggests that large-cap growth is "leading," so we will hold the Russell 1000 Growth Index
- As a baseline, we will also track a Buy/Hold/Rebalance strategy that splits money equally between the two indexes and rebalances to a 50/50 split at the end of each year
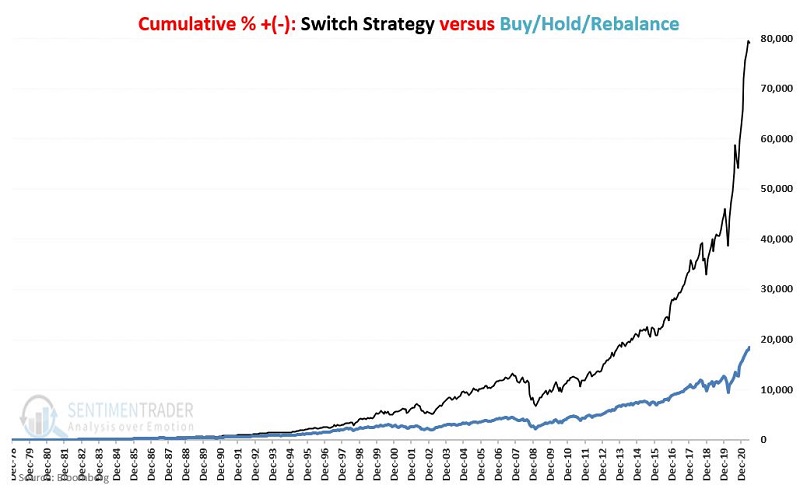
The chart below displays the cumulative growth for our "Switch" strategy versus the Buy/Hold/Rebalance strategy.
To illustrate the potential usefulness of the "Switch" approach, the chart below divides $1,000 invested using our Switch strategy $1,000 invested using the Buy/Hold/Rebalance strategy.
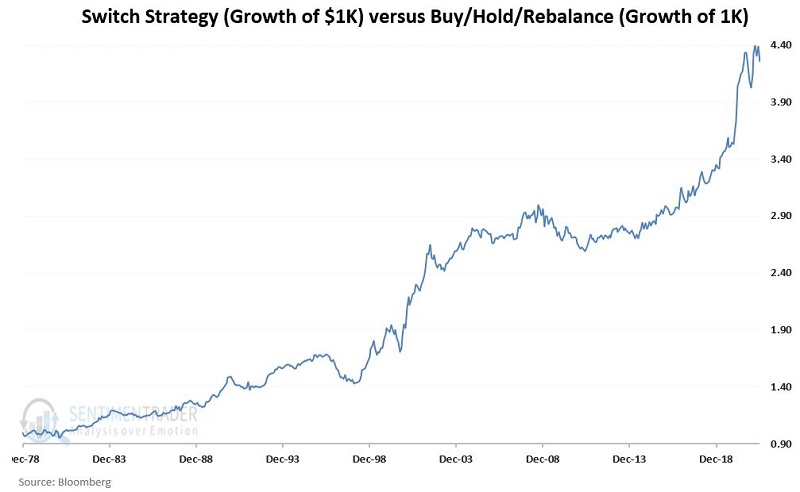
While by no means a straight-line, the results in the chart above display a long-term consistency in staying with the dominant trend (small-cap value OR large-cap growth).
APPLYING TO TODAY
Let's take one last step. In the test below:
- If Value C above is greater than 0 (i.e., if small-cap value is leading), we will hold ticker IJS (iShares S&P Small-Cap 600 Value ETF)
- If Value C above is less than 0 (i.e., if large-cap growth is leading), we will hold ticker QQQ (Invesco QQQ Trust)
- As a baseline, we will also track a strategy that splits money equally between these two ETFs and rebalances to a 50/50 split at the end of each year
- This test starts in August 2000, the first full month of trading for ticker IJS
A couple of things to note:
- Ticker IJS tracks the S&P 600 Small-Cap Value index and NOT the Russell 2000 Value index
- Ticker QQQ tracks the Nasdaq 100 index and NOT the Russell 1000 Growth index
- We are simply using IJS as a proxy for small-cap value and QQQ as a proxy for large-cap growth
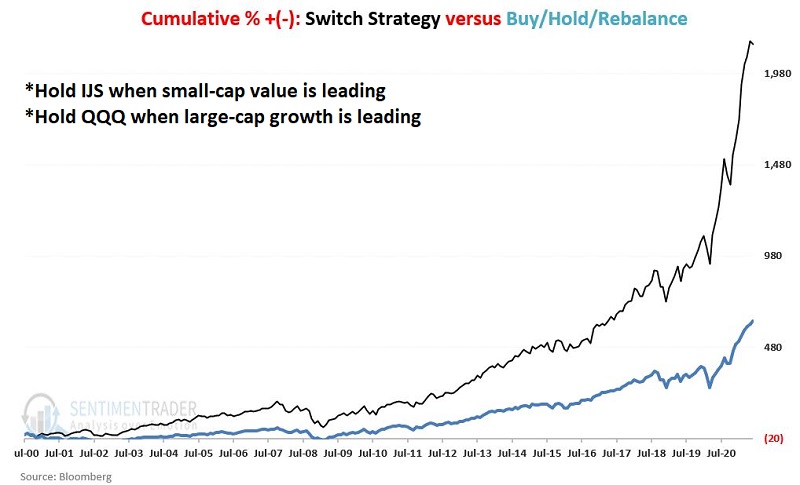
From July 31, 2000, through 6/30/2021:
- The Switch strategy (using IJS and QQQ) grew a hypothetical +2,140%
- The Buy/Hold/Rebalance strategy using IJS and QQQ) grew a hypothetical +624%
NOTE: All results are hypothetical based on monthly total return data
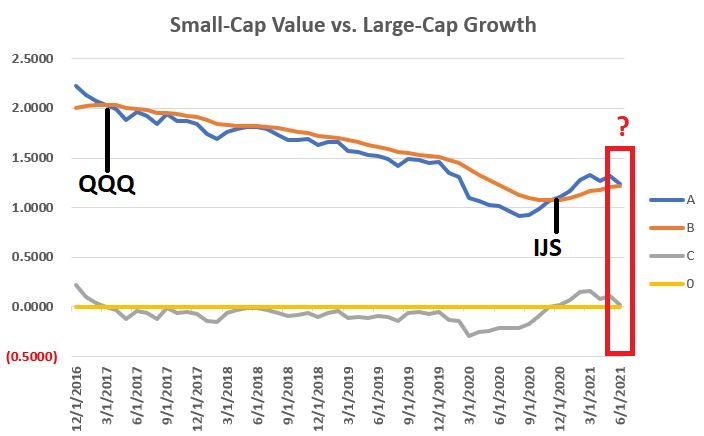
As displayed in the chart below, most recently:
- Large-cap growth led from 3/31/2017 through 12/31/2020, so QQQ was held during that time.
- Small-cap value has led since 12/31/2020, so the switch strategy presently hold IJS
However, as you can also see in the chart below, large-cap growth (and, by extension, ticker QQQ) may once again reassume the lead as early as the end of July. Did I mention that nothing lasts forever in the stock market?
SUMMARY
Repeating now: Nothing lasts forever in the markets (except, of course, human nature). Whatever is leading today may continue to lead for an extended period of time. Or the trend could reverse tomorrow. But in any event, the main thing to remember is that when the trend changes, it is important to get on board the new trend as soon as reasonably possible.