
Will March be an "Ugly" month?

Key Points
- An analysis of stock market history every month across twenty-year cycles revealed 17 out of 240 months that exhibited consistently poor results
- March 2025 is the next month in this sequence
- Is this an interesting market "tidbit," a call to action, or something in between? Review the data below and decide for yourself
NOTE: Please view our latest webinar titled "What's New on the Website" here. This video highlights a number of indicators and strategies we've added so far in 2025, including the Sentiment Cycle Composite, PPI Stock Market Model, LEISum, TNX Range %, NYSE Titanburg, and NASDAQ Titanicburg.
A quick review of the Ugly 17
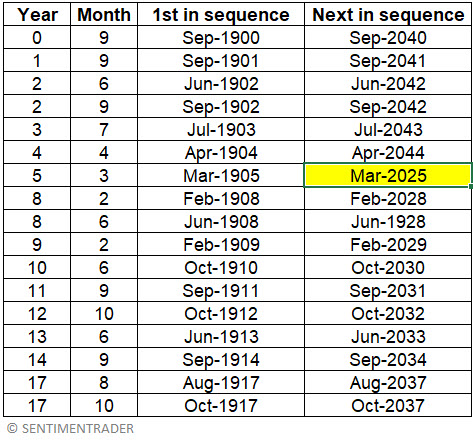
I wrote about the Ugly 17 months in 2021 in this article. The months in question occur on a 20-year cycle starting in 1900 (no, seriously) and are shown below. Note that the next month in the sequence is March 2025.
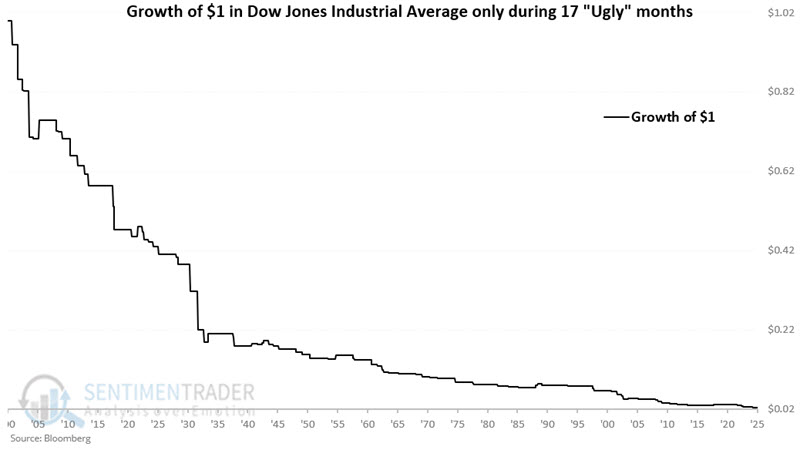
The chart below displays the cumulative % performance for the Dow Jones Industrial Average if held long ONLY during this same sequence of 17 months every 20 years.
The chart below displays the same results on a logarithmic basis.
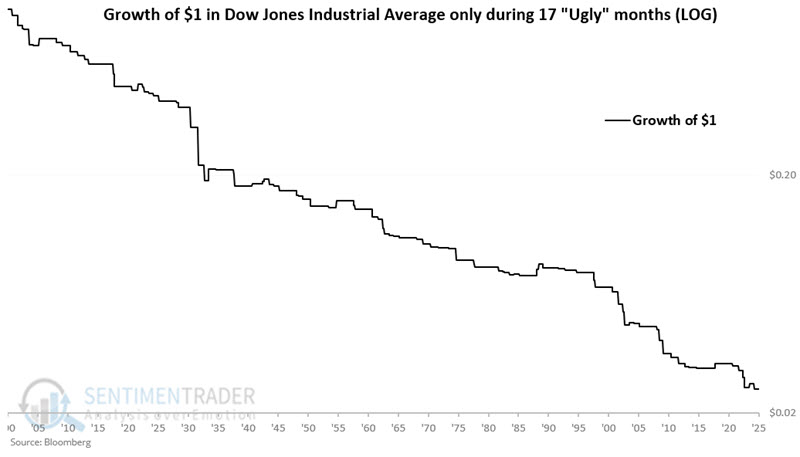
The net result is that this - held only during the same 17 months within every 20-year cycle starting in 1900- the Dow Jones Industrial Average has lost -97.5% of its value, which is pretty hard to believe (yet mathematically correct). This makes this an opportune time to issue the all-important "past performance is no guarantee of future results" caveat.
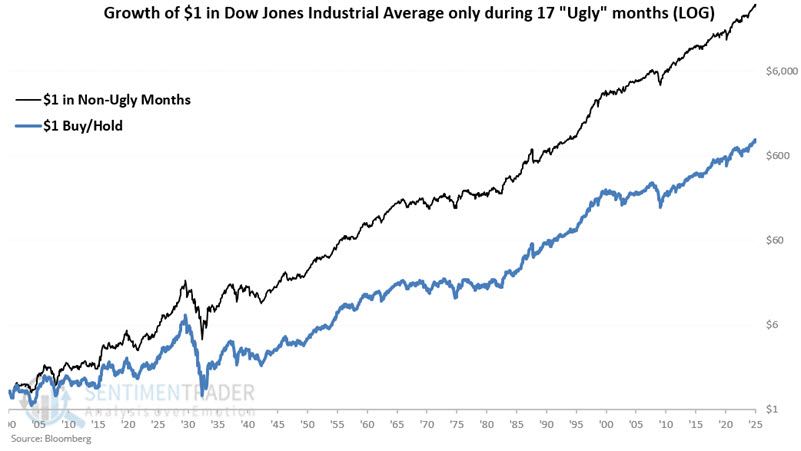
For the record, avoiding stocks during "Ugly Months" would have (hypothetically) significantly enhanced long-term returns. The chart below displays the hypothetical growth of $1 in the Dow Industrials during all "Non-Ugly Month" (black line: $1 would have grown to $36,404) and the growth of $1 on a buy-and-hold basis (blue line: $1 would have grown to $920).
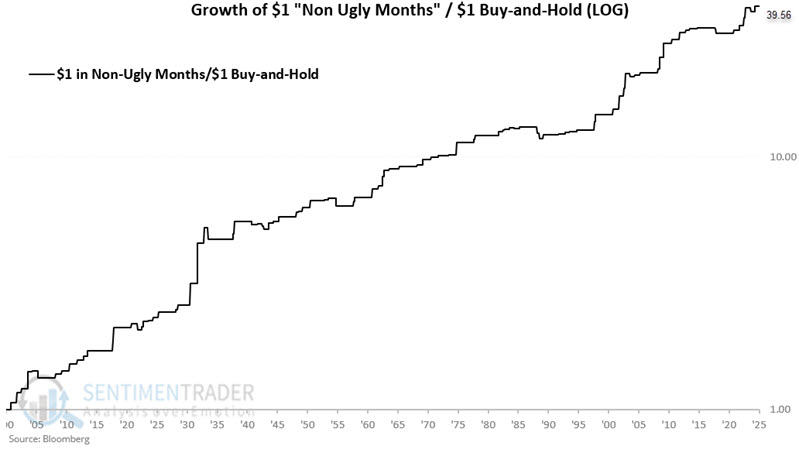
To better illustrate the difference, the chart below divides the hypothetical growth of $1 invested in the Dow Industrials only during "Non Ugly Months" by the hypothetical growth of $1 invested in the Dow on a buy-and-hold basis.
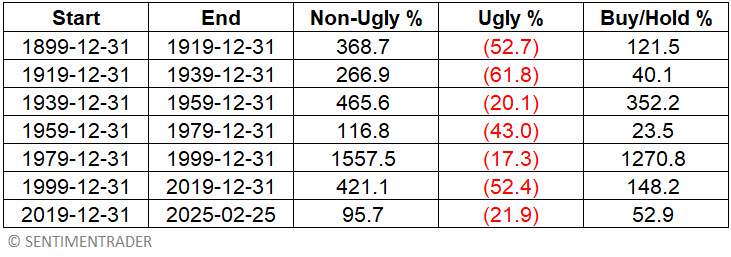
To fully appreciate the truly, um, ugly nature of ugly months, note the summary of performance for the Dow Jones Industrial Average for each previous 20-year period in the table below. The last line in the table reflects performance from the end of 2019 through 2025-02-25.
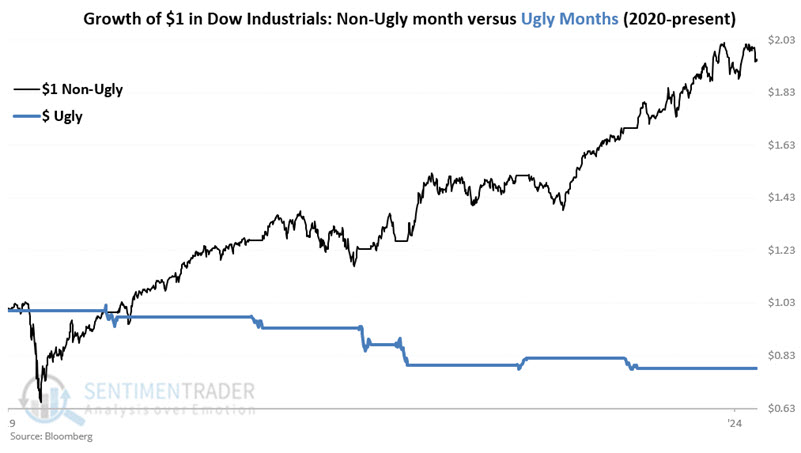
The chart below displays the hypothetical growth of $1 invested in the Dow Jones Industrial Average since the start of the most recent 20-year cycle (2019-12-31). The black line shows the growth of $1 invested only during "Non-Ugly" months, and the blue line shows the growth of $1 invested only during "Ugly" months.
Looking ahead
Given what we've seen so far, how concerned should investors be that "Year 5, Month 3" - i.e., March 2025 - is the next Ugly 17 month on the list? Unfortunately, each investor must answer that question for themselves.
The table below displays the performance of Year 5, Month 3.
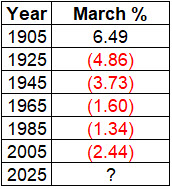
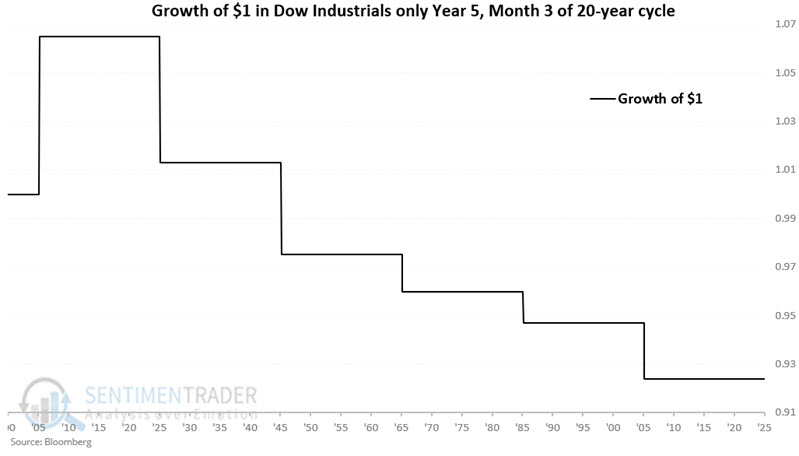
This month has been down five out of six times, with an average loss of -1.25% and a median loss of -2.02%. The chart below displays the cumulative % performance for the Dow Jones Industrial Average if held ONLY during Year 5, Month 3 every 20 years.
What the research tells us…
So, are investors really to invest - or not - based on some "mystical" forces that purportedly cause the market to move in a particular direction during 17 specific months across every 20 years? Likewise, does it make sense to "Sell Everything" for a month to theoretically avoid what has averaged roughly a 1% to 2% monthly loss (although March 1925 was down -4.86%)? And does what happened in 1925 really bear any meaning for what might happen next month? Again, these are questions that each investor must answer for themselves.
Still, it is worth noting one more time that the history of "Ugly Months" is pretty, well, ugly.