
Will January 2025 be Metals Month?

Key Points
- Several metals markets have a history of showing strength early in the year
- The last several years have been an exception to the rule (Will 2025 revert to form?)
- ETFs offer non-futures traders the potential to participate without the leverage involved in futures trading
Silver often starts strong
In these previous articles, I have written favorably about silver:
It's time to keep an eye on silver (and to be patient) - Part I
It's time to keep an eye on silver (and be patient) - Part II
It's time to pay close attention to silver
The chart below displays the annual seasonal trend for silver futures. The first 33 trading days of the year (i.e., starting at the close on the last trading day of December) tend to show strength.
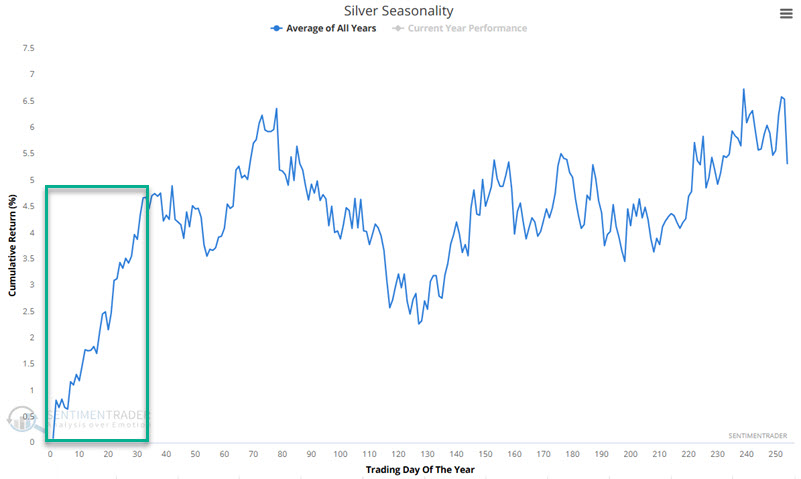
We see the apparent tendency for silver to start the year strong, with January seemingly offering a straight-line advance. However, this is where it is critical to note that seasonality is NOT a roadmap but merely an average of previous years. It is also an excellent time to remember that results can vary widely from year to year.
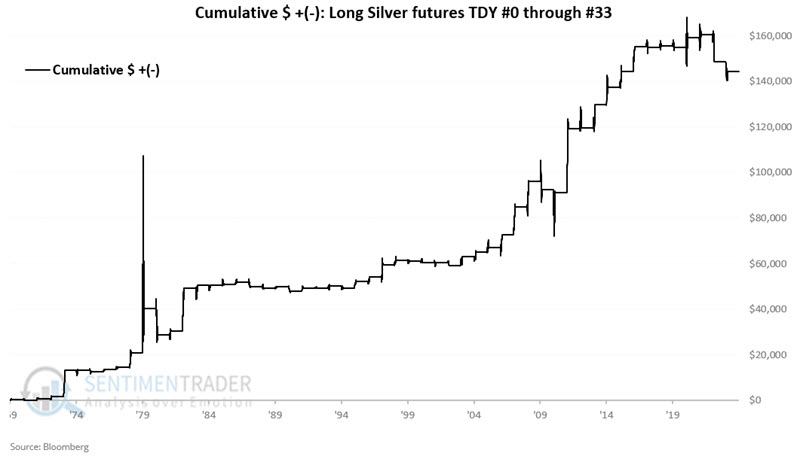
The chart below displays the cumulative hypothetical results for holding a long position in silver futures only during the first 33 trading days of the year every year since 1970.
The table below summarizes the results.
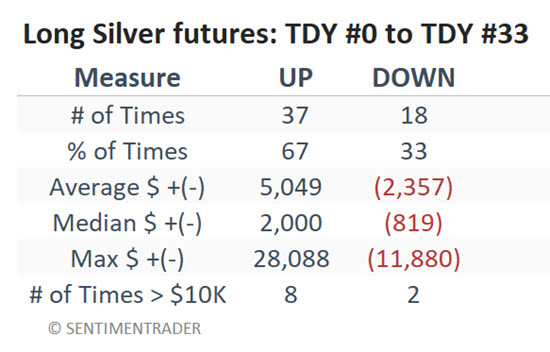
Overall, the results have been favorable. However, the real thing to pay attention to is the potential risk. First, we note that historically, this period has shown a loss in one out of every three years. So, "soaring silver in January" is far from a "sure thing." Even more sobering is that silver has lost big during this period in the two most recent years (over-$11,000 in 2023 and-$4,000 in 2024). So, having a stop-loss point is a primary consideration for any trader looking to play silver in the near term.
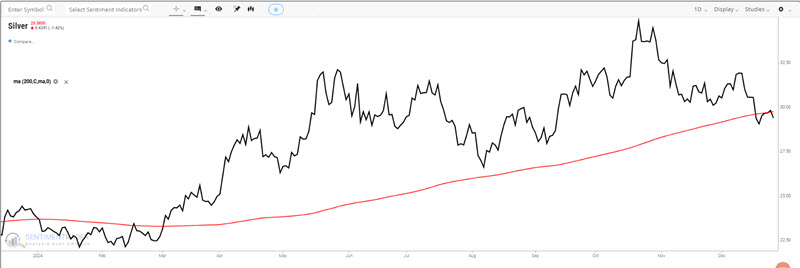
The other obvious question is, "Is this period no longer favorable for silver, or will 2025 revert to historical form?" Unfortunately, the reality is that there is no way to predict. Historically, seasonality is best combined with price action. The best time to play a seasonal trend is when both seasonality and price agree. At the moment, that is not quite the case for silver. The chart below shows silver trading just below its 200-day moving average. A move back above the average would be a favorable sign for silver.
It's the most platinum time of the year
The chart below displays the annual seasonal trend for platinum futures. The first 36 trading days of the year (i.e., starting at the close on the last trading day of December) tend to show strength.
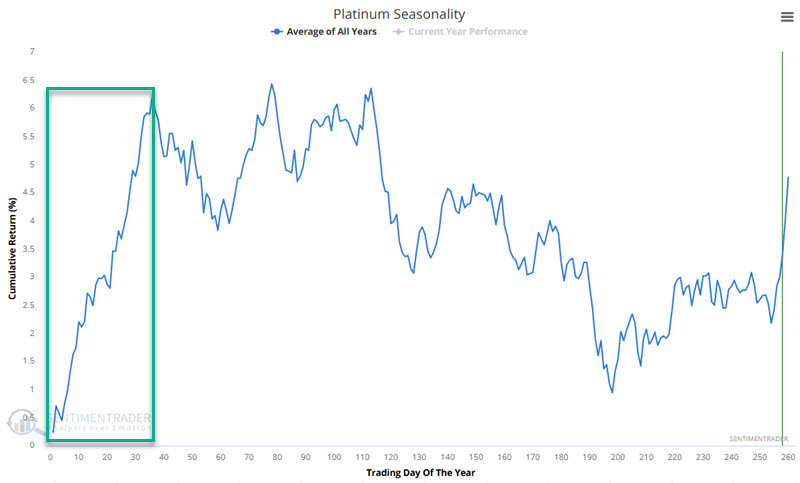
We see the apparent tendency for platinum to start the year strong. The same caveats discussed above for silver apply here also.
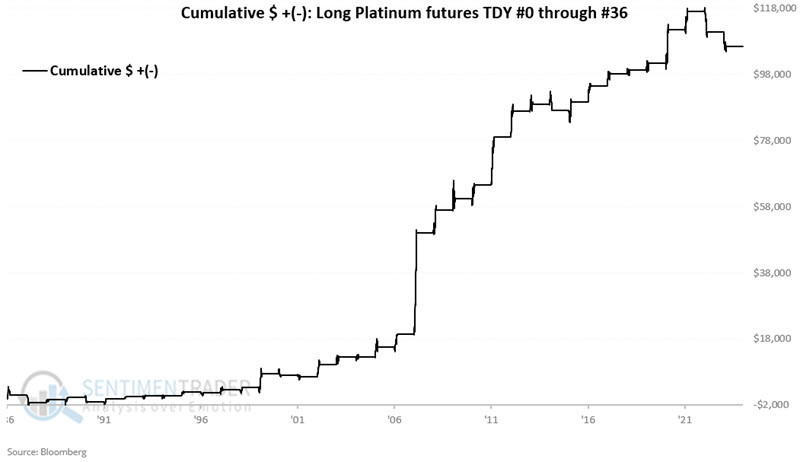
The chart below displays the cumulative hypothetical results for holding a long position in platinum futures only during the first 36 trading days of the year every year since 1987. Hereto, platinum has experienced losses during the last two years during this supposedly favorable period.
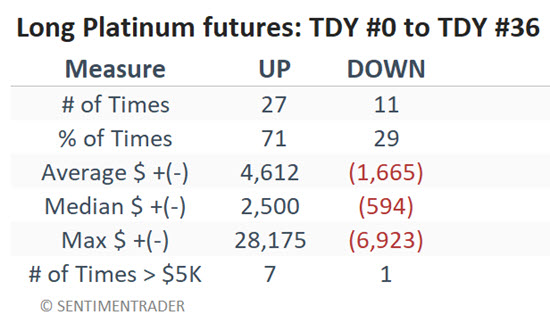
The table below summarizes the results.
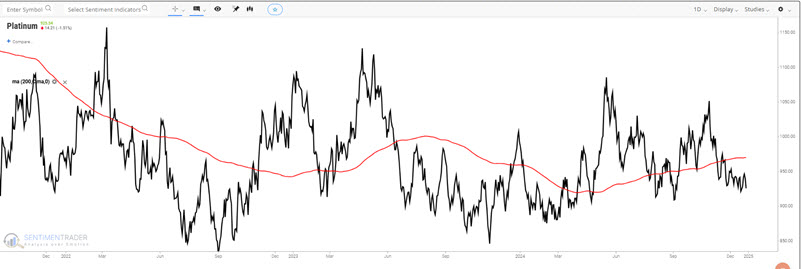
As seen in the platinum price chart below, seasonality and price are not presently in agreement.
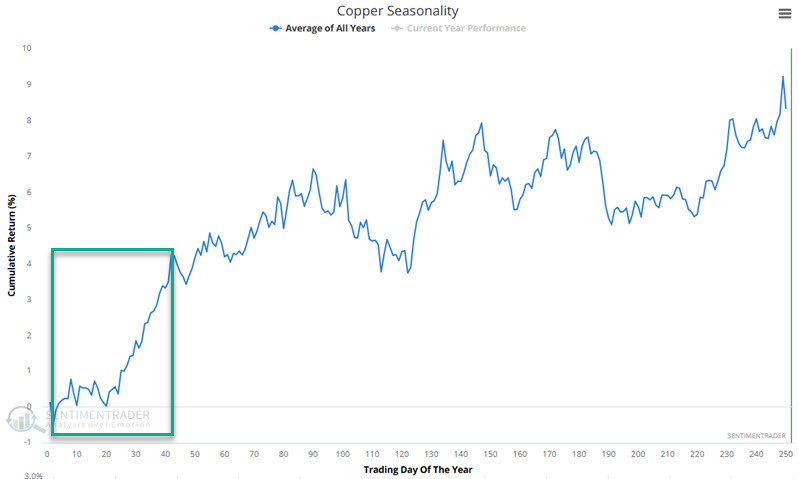
Copper also tends to see early-year strength
The chart below displays the annual seasonal trend for copper futures. The period from the close of Trading Day of Year (TDM) #2 through #43 tends to show strength.
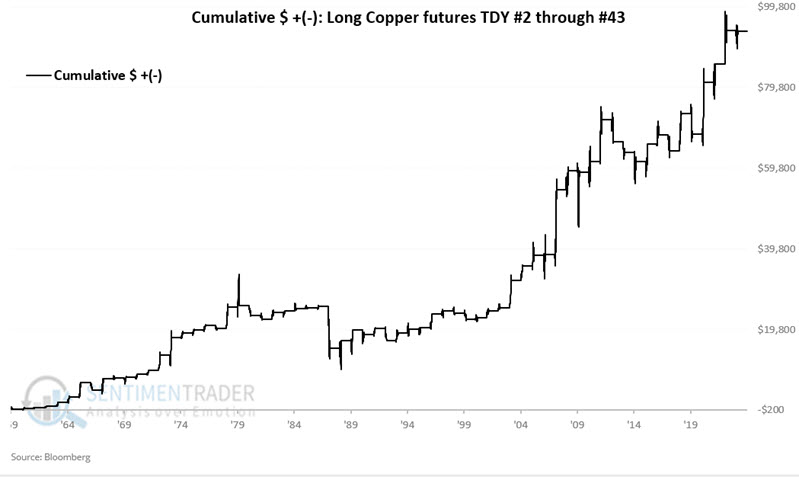
The chart below displays the cumulative hypothetical results for holding a long position in copper futures only during this 41 trading day period every year since 1960
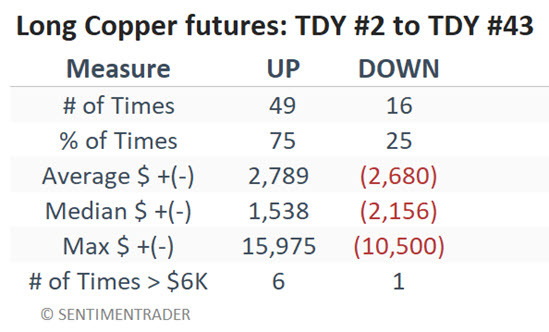
The table below summarizes the results.
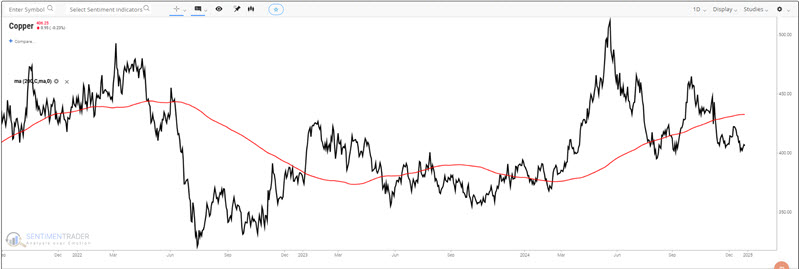
Confidence in playing the long side of copper would improve if copper can return to an established uptrend.
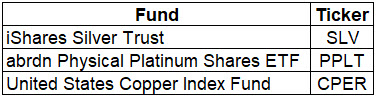
ETF alternatives for non-futures traders
Trading futures contracts entail a significant amount of leverage and theoretically unlimited risk. Traders who want to play these markets in a stock account without that leverage can use the ETFs listed in the table below.
What the research tells us…
History suggests the potential for strength in the metals markets early in 2025. As detailed above, however, there are plenty of caveats. The real message is that if the markets detailed above begin to show strength in early 2025, aggressive, alert traders should be ready to act. In the meantime, further patience would seem to be in order.