
Will coffee return to earth's atmosphere?

Key Points
- Coffee futures are staging a historic price run
- There is no way to predict how far and how long this run will last
- Nevertheless, patient, aggressive traders should be watching closely for a reversal as history suggests the decline following the next top may be just as fast and furious as the advance itself
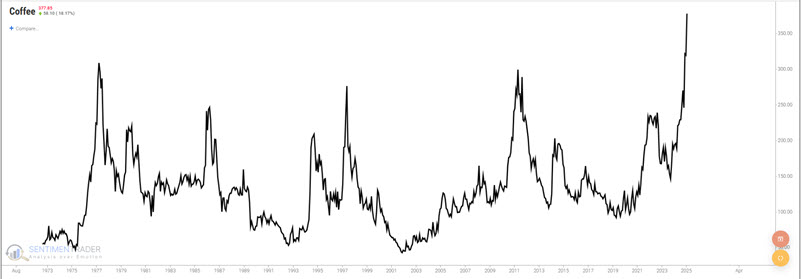
A massive spike in price
In the chart below, coffee futures have recently reached their highest price ever and show no signs of slowing down.
The chart below displays the 252-day percentage rate-of-change for coffee futures, starting in 1973. The blue line is drawn at the 90% level. As you can see, this level is not often reached, and we are above it now.
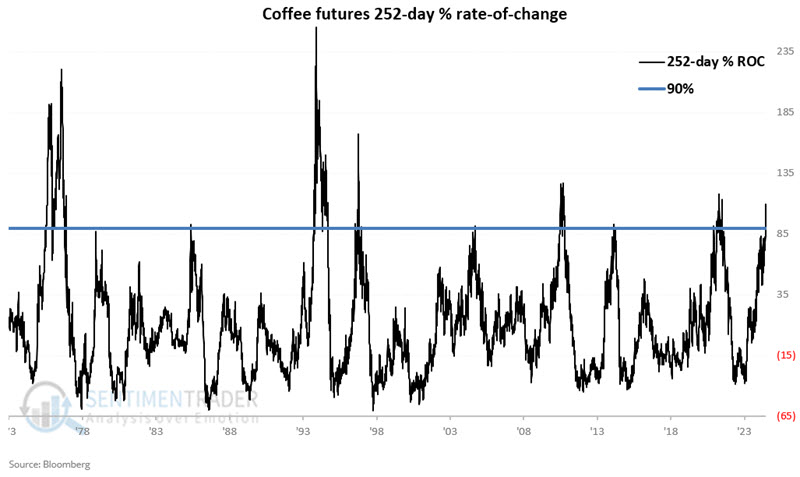
A couple of essential points:
- A 90%+ 12-month rate-of-change is rare and highlights a powerful performance
- Crossing above 90% IN NO WAY marks any "topping" signal. In other words, coffee can pierce that seemingly "extreme" level and then keep going much higher
So why even bother to note when the 252-day ROC has crossed above 90%? Because, if nothing else, it typically tells us that "the clock is ticking." In other words, while it does not tell us when the top will occur, it alerts us that a top is likely approaching and that a significant reversal will likely follow.
+90% rate-of-change versus not
To understand the message above, let's run the following test.
- When the 252-day rate-of-change for coffee is above 90%, we will set a "Warning Counter" to 252 days
- As long as the 252-day ROC stays above 90%, the counter remains at 252
- If the 252-day rate-of-change for coffee is below 90%, we will subtract one from our counter until the counter reaches 0
The chart below displays the history of this Warning Counter. Remember, a reading of 252 should not be thought of as a "Sell" signal but rather as a "warning sign," while a reading of 0 suggests "no warning sign."
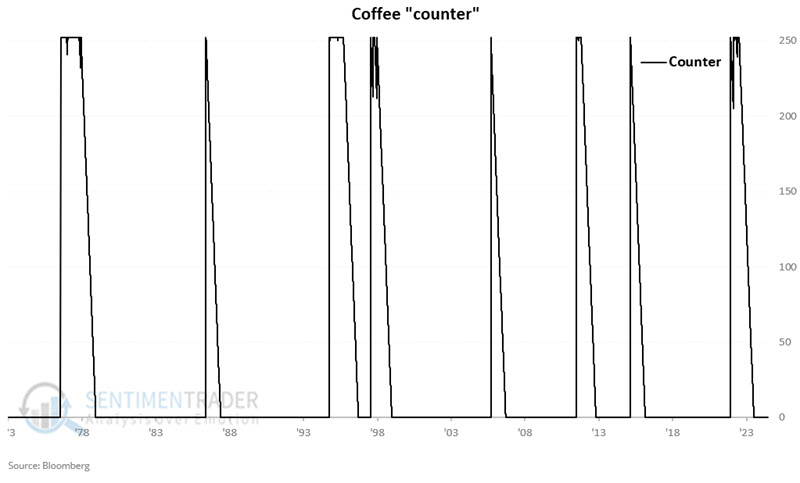
Note that on some occasions, the counter remains at the 252 level for a while (this occurs during sustained major advances in the price of coffee), and other times, only for a short while. The chart below displays the cumulative hypothetical gain from holding a long position in coffee futures ($375 a point) only when the counter = 0. The hypothetical $ +(-) is +$276,589.
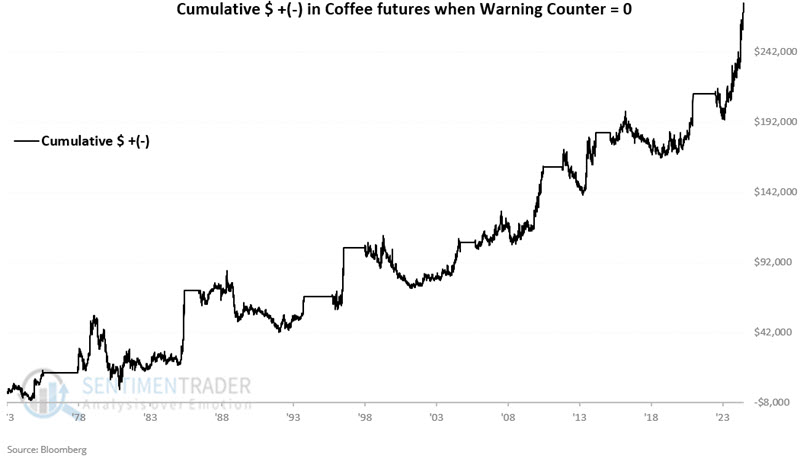
On the other hand, the chart below displays the cumulative hypothetical gain from holding a long position in coffee futures ($375 a point) when the counter > 0. The hypothetical $ +(-) is -$151,208.
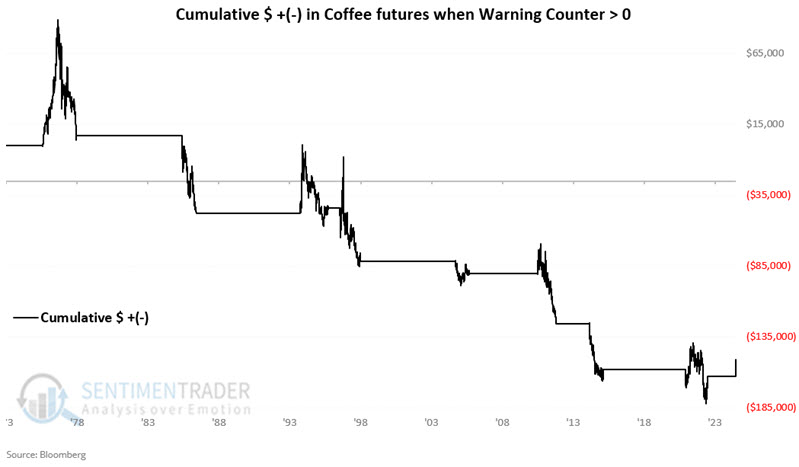
The chart above tells us that once the 252-day ROC for coffee futures exceeds 90%, the advance is on borrowed time, and a significant downside reversal is likely in the year ahead.
Unfortunately, the Warning Counter is not always a very accurate "timing" indicator - as coffee can continue to advance for some time after the first ROC reading above 90%.
Let's next factor in price trends to make this information useful for trading purposes.
Using price as a trend filter
Let's apply the following to coffee futures:
A = Warning Counter detailed above (set at 252 if 252-day ROC for coffee futures is > 90%; stays at or resets to 252 for each day 252-day ROC is above 90%; Declines by one for each day below 90% with a minimum reading of 0)
B = Daily closing price for coffee futures
C = 70-day exponential moving average (EMA) of B
D = B - C
E = If A = 0 then E = 2 else E = 0 (If Warning Counter = 0 then +2 else 0)
F = If D > 0 then F = 1 else F = 0 (If last close > 70-day EMA then +1 else 0)
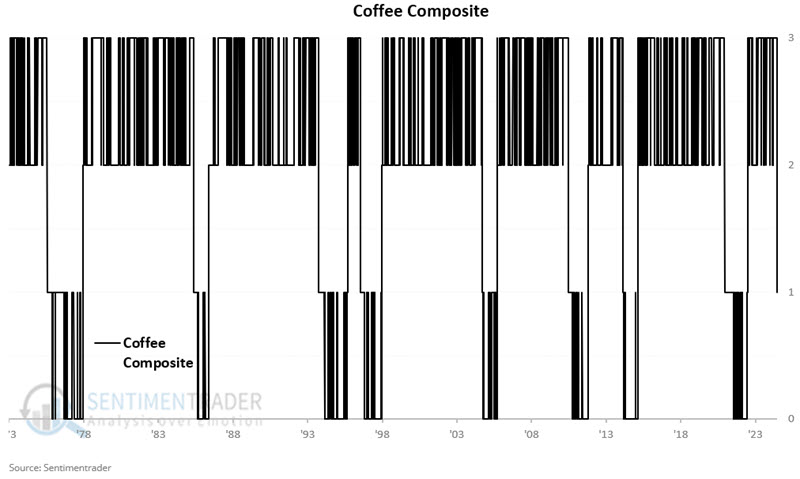
G = E + F
So, Variable G can be 0, 1, 2, or 3 on any given day. From here, we will refer to Variable G as our Coffee Composite. The chart below displays daily readings for this indicator since 1973.
Coffee Composite readings of +3
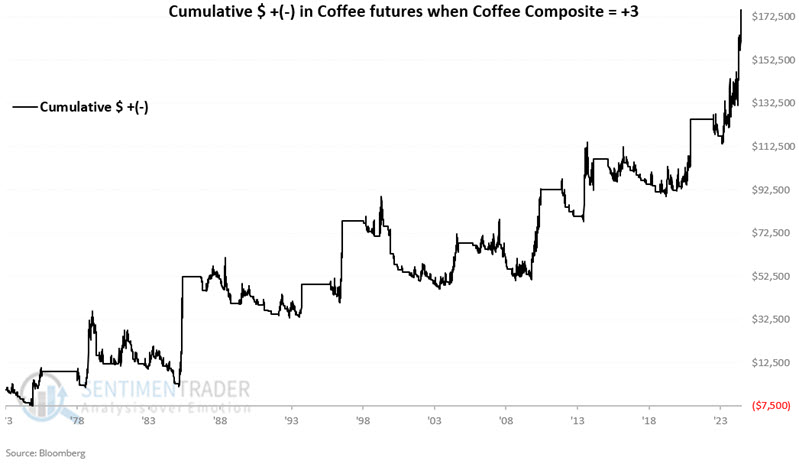
If the 252-day rate-of-change for coffee futures has not been above 90% for at least 252 days AND the latest closing is above the 70-day EMA, then the Coffee Composite will read +3. The chart below displays the hypothetical cumulative growth from holding a long position in coffee futures only while the Coffee Composite = +3. The hypothetical cumulative gain is $175,657.
Coffee Composite readings of +2
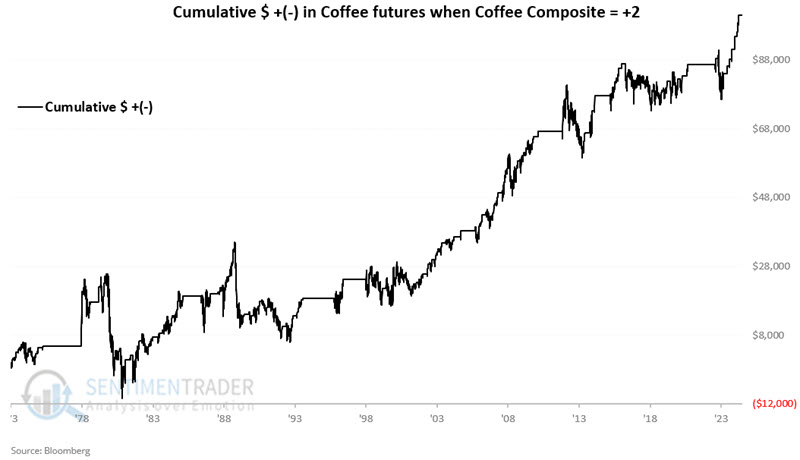
If the 252-day rate-of-change for coffee futures has not been above 90% for at least 252 days AND the latest closing is below the 70-day EMA, then the Coffee Composite will read +2. The chart below displays the hypothetical cumulative growth from holding a long position in coffee futures only while the Coffee Composite = +2. The hypothetical cumulative gain is $ 100,931.
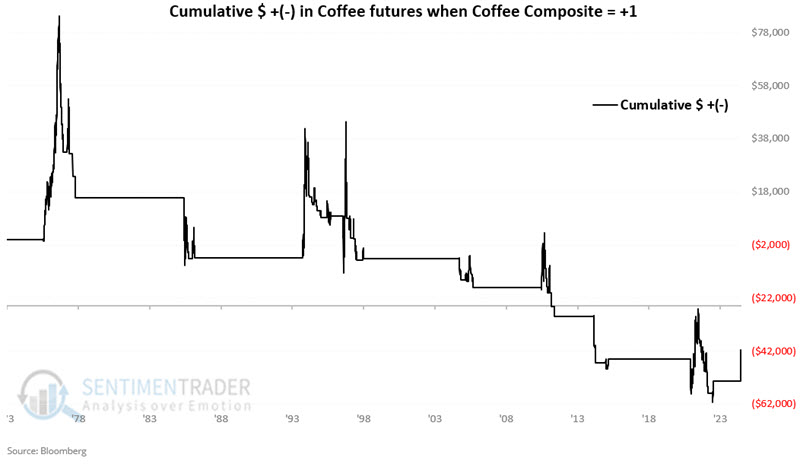
Coffee Composite readings of +1
If the 252-day rate-of-change for coffee futures has been above 90% at some point in the last 252 days AND the latest closing is above the 70-day EMA, then the Coffee Composite will read +1. The chart below displays the hypothetical cumulative growth from holding a long position in coffee futures only while the Coffee Composite = +1. The hypothetical cumulative loss is -$41,479.
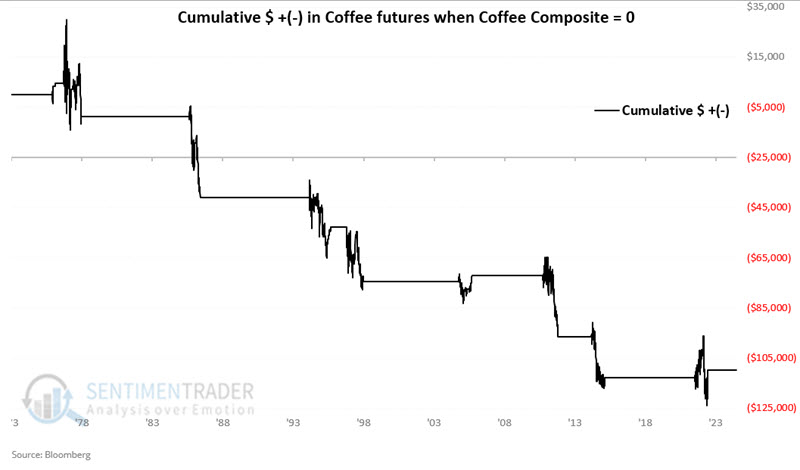
Coffee Composite readings of 0
If the 252-day rate-of-change for coffee futures has been above 90% at any time in the last 252 days AND the latest closing is below the 70-day EMA, then the Coffee Composite will read 0. The chart below displays the hypothetical cumulative growth from holding a long position in coffee futures only while the Coffee Composite = 0. The hypothetical cumulative loss is -$109,729.
The current reading for the Coffee Composite = +1.
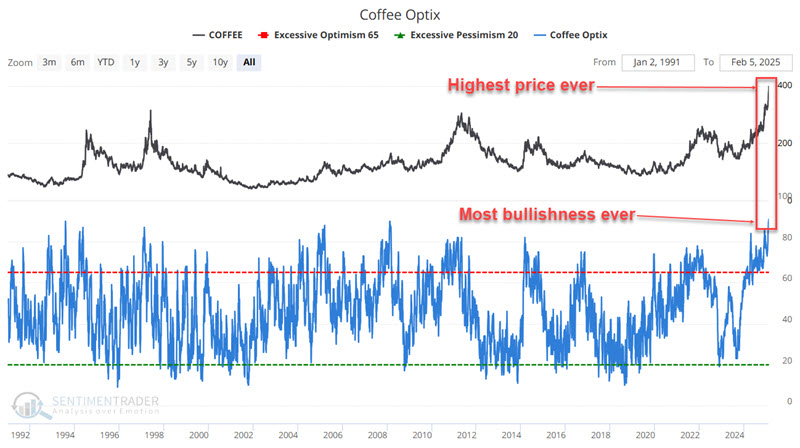
The bulls are running - and in agreement
The chart below shows that our Coffee Optix indicator just closed at its highest level ever (91%). Is this an automatic "Sell" signal? Not necessarily, because the price uptrend can continue indefinitely. What this reading does is alert us to be watching closely for a reversal.
The chart below displays Coffee Optix's 50-day moving average and notes with a red dot on occasions when the value crossed below 71.
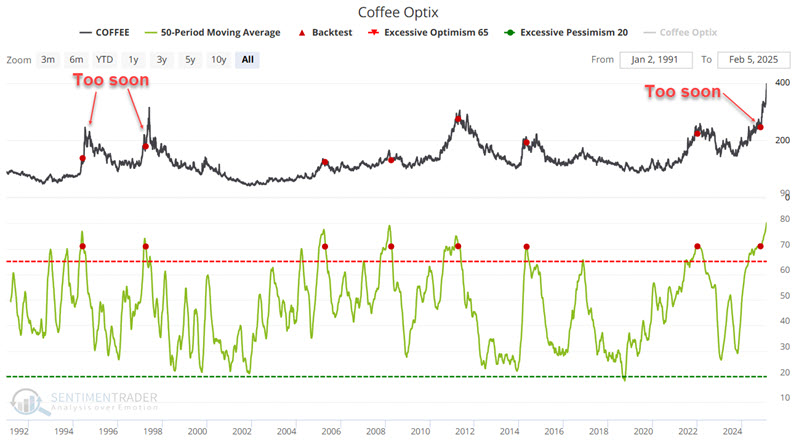
The table below displays coffee price action following the signals highlighted above.
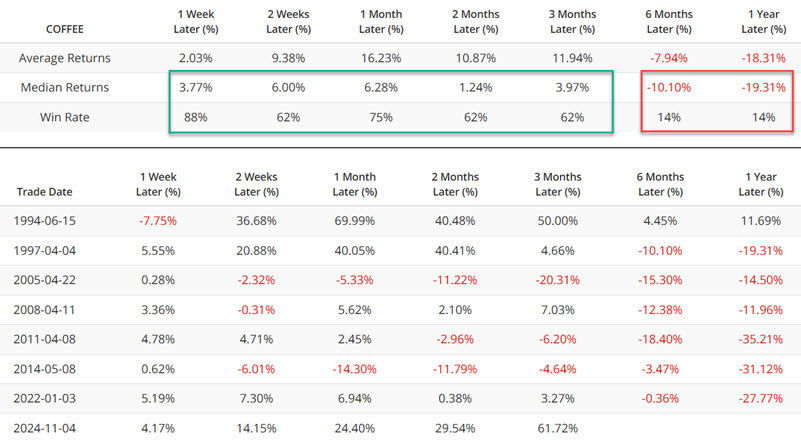
There are some important things to note:
- Once again, this is NOT a "precision market timing tool." In the chart and table above, we can note that several signals (including the most recent on 2024-11-04) were followed by continued, significant price spikes
- The first three months after a signal have tended to witness some degree of further price strength
- However, on only one occasion did coffee gain ground between the 3-month after a signal mark and 12-months after a signal (that was in 2005 when coffee lost over 20% in the first three months after the 2005-04-22 signal and was only down -14.5% nine months later)
In the three months following the 2024-11-04 signal, coffee has soared by an incredible 61.7%. Can it continue to roar higher? Absolutely. However, history strongly suggests the potential for swift and severe downside is great whenever the top and reversal come.
What the research tells us...
The history of coffee trading strongly suggests that the rally in this market is running on borrowed time and that the downside will likely be ferocious once the top is in. But that comment should NOT be considered a "sell short now" signal. The reality is that there is no way to predict how long and how far the current rally can run (and stepping in front of a roaring freight train is not advisable). The message in coffee appears to be "pay attention and wait for some objective signs of an actual top before attempting to jump in on the short."