
Wild-eyed speculation in gold stocks and silver (on the cheap)

Key points
- Speculation in general - and picking tops and bottoms specifically - is considered by some to be a dirty word. But it can have a place in a trader's repertoire
- Gold stocks and silver have performed very poorly so far in 2024
- Below, we look at two examples of extremely speculative trades in these two typically highly seasonal markets
Investing versus trading
Some use the words investing and trading interchangeably. I view them as two similar - but separate - endeavors. My unofficial definitions of each are as follows:
Investing: Putting money to work in hopes that it will grow over time.
Trading: Buying or selling short something in hopes of making money right now
The act of buying and selling is the same, but the mindset is different. Successful investing is often a function of "not acting" (based on the latest twist and turn in the market or the latest narrative in the news). Successful trading is typically a function of "acting decisively" when the time arrives to do so.
A word on "speculation"
Some would consider all "trading" to be speculative - and a strong argument can be made in this regard. For my own purposes, I consider "speculation" to be a subset of trading. Generally, a "trade" would be entered only when the belief is that there is a reasonable probability of success. On the other hand, a speculation (i.e., a speculative trade) might be entered for any reason - or for almost no reason at all.
The unwritten rule is that speculative trades should be avoided altogether. However, some of us can't quite get the immortal words of Manfred Mann out of our heads - "But Mama, that's where the fun is."
My purpose here is NOT to convince you to become more of a speculator or risk-taker. My purpose here is to point out that it can be done without throwing caution to the wind. The two primary principles of speculative trading in my book are:
- Make speculative trades a small portion of your trading activity
- Risk a little to make a lot
Let's take a closer look at some examples. Please note that the example trades highlighted below are just that - examples and NOT specific recommendations.
Gold stocks and silver continue to draw interest
I often refer to gold bullion as the market that "never misses an opportunity to miss an opportunity." Just when it looks like gold is about to break out and make a run, it seems to hit a hard ceiling and fall back. For many years, gold stocks have been an even worse performer. Meanwhile, another pack of people closely monitor silver in the hopes that "when the rally comes," silver will outperform gold (for reasons no one ever seems to explain fully). So, let's take a closer look.
We will start with seasonality. As I use it, seasonality is not a standalone trading tool but something I use to tell me "When to look where" and/or "in which direction to be looking." The charts below display the annual seasonal trends for the Market Vectors Gold Miners ETF (ticker GDX) and the iShares Silver Trust ETF (ticker SLV).
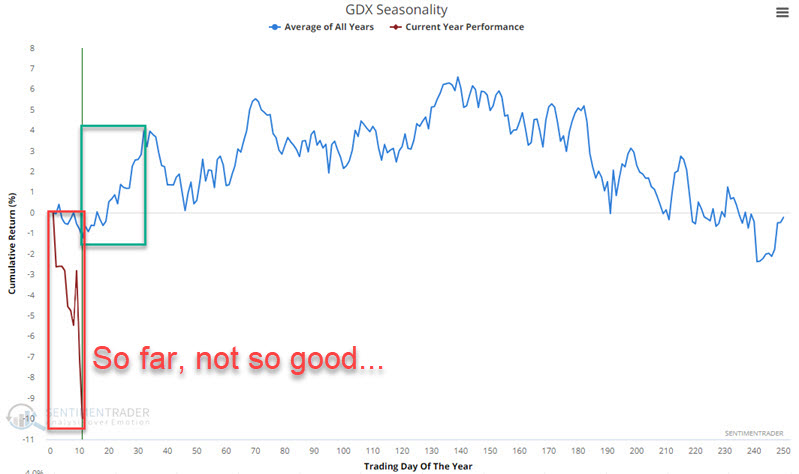
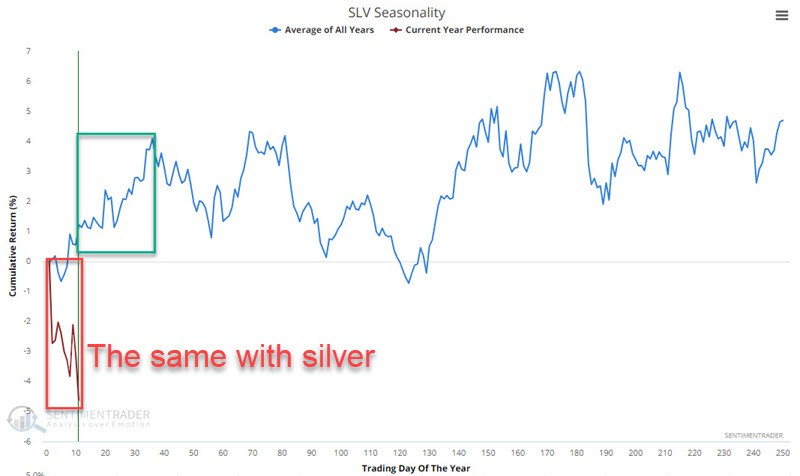
Both GDX and SLV have a) shown a historical tendency to rally into mid-February and b) traded sharply lower so far in 2024.
So, one of two scenarios would seem to be setting up. Either:
- Early 2024 is simply not going to follow the general script of early strength
- These ETFs are due for a sharp rebound rally
Two important points for the record:
- I do not possess the ability to predict with any accuracy which scenario will play out
- I typically look for the price to be moving in the expected seasonal direction (in these cases - up) before jumping in
Nevertheless, given the potential for a quick turnaround and a meaningful bounce, the potential to enter a speculative trade rears its head. So, let's consider the possibility.
Using options as a way to limit risk and cost
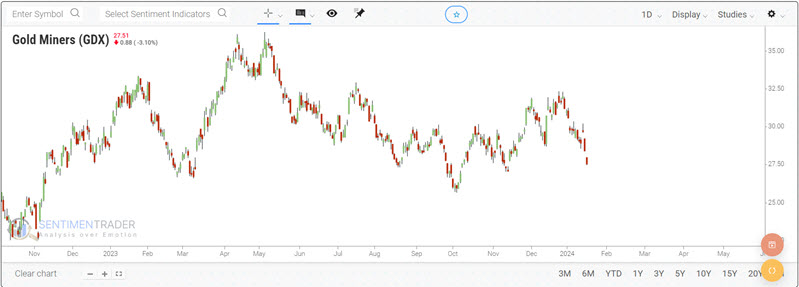
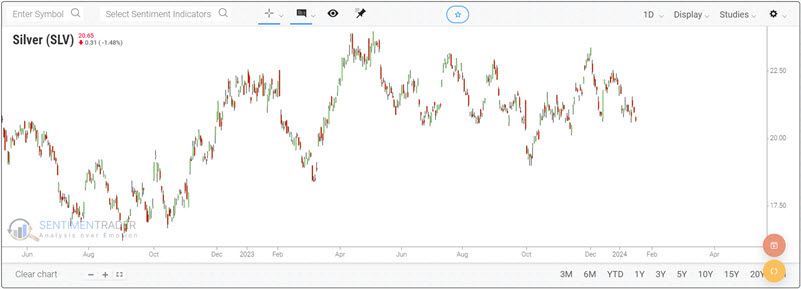
The most straightforward play for the tickers above would be to buy 100 shares of GDX and 100 shares of SLV (this would cost $2,751 and $2,065, respectively). The question then would be where to cut a loss. As you can see in the stock charts below, each security has certain levels that could be chosen.
Let's go a different route and look at simple long-call options on both securities to limit cost and risk while leveraging profit potential. We will look to establish positions with a "Delta" close to 100 - to replicate a long 100 shares position essentially.
A closer look at GDX
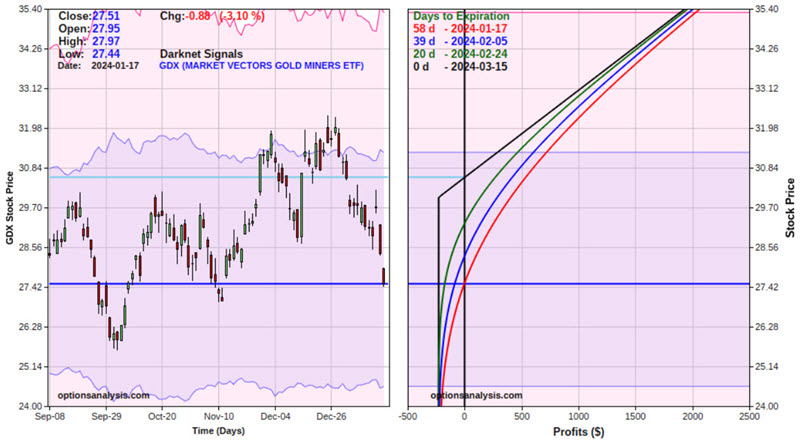
For our example trade, we will buy 4 GDX 2024 March15 30 strike price calls @ $0.57. The particulars for this trade and the risk curves (i.e., the expected profit or loss as of a given date based on the price of GDX shares) appear below. The black line in the risk curve chart represents the expected P/L as of option expiration on March 15th.
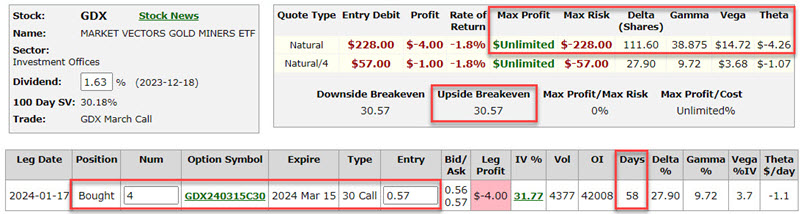
This is a very speculative position. Things to note:
- The cost to enter - and maximum risk - is $228
- The breakeven price - if held until expiration - is $30.57 (strike price + option cost)
- The total position has a Delta of 111.60, which means that for now, it will behave like a position of long 111 shares of GDX
- Note, however, that the option itself has a Delta of 27.90, which essentially means that if held until expiration, there is roughly a 28% probability that the option will be in-the-money
- Note also the Theta value of -$4.26, which means this position will lose that amount each day due solely to time decay
The bottom line is pretty straightforward: If GDX does rally, this position has the potential to generate a large percentage gain. If GDX does not rebound, this position is sure to lose money. The only saving grace is that the worst possible scenario is a loss of -$228.
Managing the GDX speculative position
If things go south, the choices for a trader are a) just let it ride, knowing the worst case if a loss of -$228, or b) picking some stop-loss price for GDX shares and exiting the option trade and try to salvage some premium if that price is hit.
If things go right, the trader must decide when to take a profit. For a speculative trade like this, it is not a bad idea to think about selling part of the position at the first decent opportunity (for example, the 4-day RSI hits 80 or higher or an open profit of +$228 or more exists).
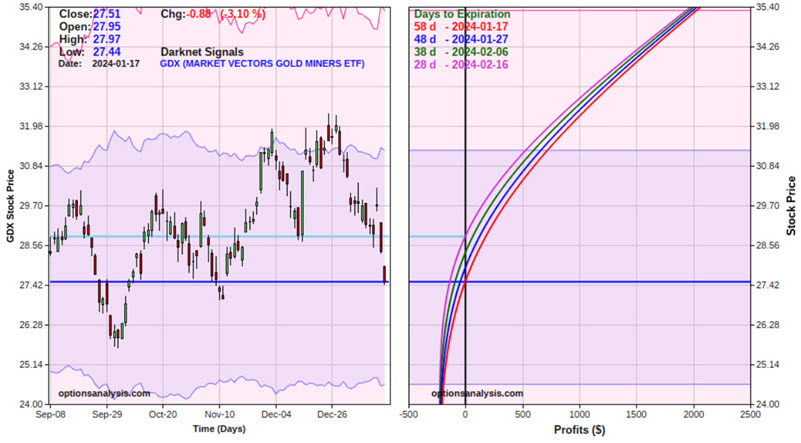
In any event, based on the GDX Seasonality chart above, we will look to exit this trade by Trading Day of Year #32 (2024-02-15). The chart below displays the risk curves only through that date, 28 days before option expiration. One benefit to exiting by Feb. 15 is avoiding the acceleration of time decay during the last few weeks leading up to option expiration.
A closer look at SLV
For our example trade, we will buy 2 SLV 2024 March15 21 strike price calls @ $0.68. The particulars for this trade and the risk curves (i.e., the expected profit or loss as of a given date based on the price of SLV shares) appear below. The black line in the risk curve chart represents the expected P/L as of option expiration on March 15th.
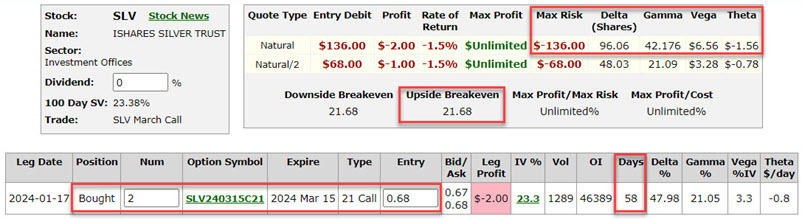
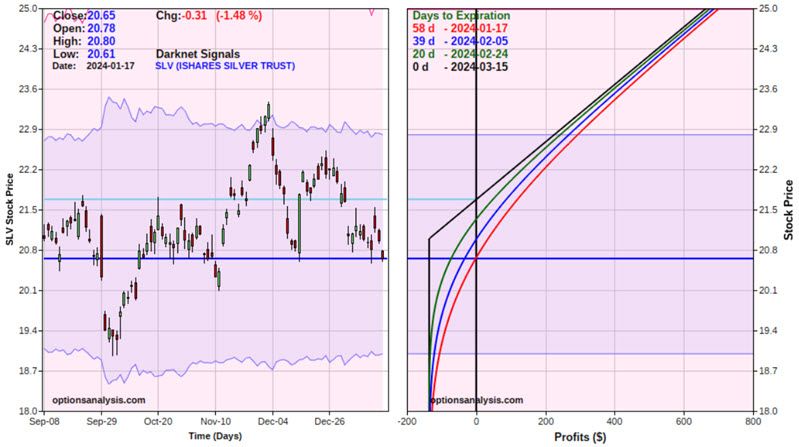
- This is a very speculative position. Things to note:
- The cost to enter - and maximum risk - is $136
- The breakeven price - if held until expiration - is $21.68 (strike price + option cost)
- The total position has a Delta of 96.06, which means that for now, it will behave like a position of long 96 shares of SLV
- Note, however, that the option itself has a Delta of 47.98, which essentially means that if held until expiration, there is roughly a 48% probability that the option will be in-the-money
- Note also the Theta value of -$1.56, which means this position will lose that amount each day due solely to time decay
The bottom line is pretty straightforward: If SLV does rally, this position has the potential to generate a large percentage gain. If SLV does not rebound, this position is sure to lose money. The only saving grace is that the worst possible scenario is a loss of -$136.
Managing the SLV speculative position
If things go south, the choices for a trader are a) just let it ride, knowing the worst case if a loss of -$136, or b) picking some stop-loss price for SLV shares and exiting the option trade and try to salvage some premium if that price is hit.
If things go right, the trader must decide when to take a profit. For a speculative trade like this, it is not a bad idea to think about selling part of the position at the first decent opportunity (for example, the 4-day RSI hits 80 or higher or an open profit of +$136 or more exists).
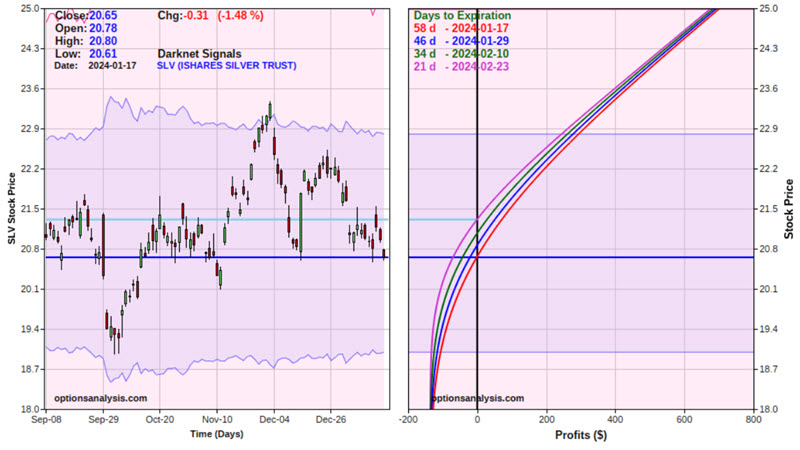
In any event, based on the SLV Seasonality chart above, we will look to exit this trade by Trading Day of Year #36 (2024-02-22). The chart below displays the risk curves only through that date, 21 days before option expiration. One benefit to exiting by Feb. 22 is avoiding the acceleration of time decay during the last few weeks leading up to option expiration.
What the research tells us…
Is it wrong to "speculate" in the markets? That is a question for each trader to answer for themselves. Will gold stocks or silver bounce sharply in the month ahead? No such suggestion is being made. The trades above are examples of one approach to shooting for leveraged gains with limited dollar risk. Remember the key phrase: Risk a little for the potential to make a lot.