Products
SentimenTrader Trading Tools
‍
Backtest Engine
My Trading Toolkit
Correlation Analysis
Seasonality
Indicators & Data API
‍
Proprietary Indicators & Charts
Market Data API
Strategies & Scanner
‍
50+ Trading Strategies
Smart Stock Scanner
Research Reports
‍
Research Solutions
Reports Library
Free Resources
Simple Backtest Calculator
Simple Seasonality Calculator
The Kelly Criterion Calculator
Sentiment Geo Map
Public Research Reports
Education
Sentiment Indicators
Technical Indicators
Pricing
Company
About
In the News
Testimonials
Client Success Stories
Contact
Log inLoginSign up
< BACK TO ALL REPORTS

Why the Nasdaq looks washed out

Jason Goepfert
2022-02-25
The number of 52-week highs vs lows on the Nasdaq has reached a washed-out extreme. The rolling 2-year return on commodities has flipped positive.

Nasdaq high/low ratio has been washed out

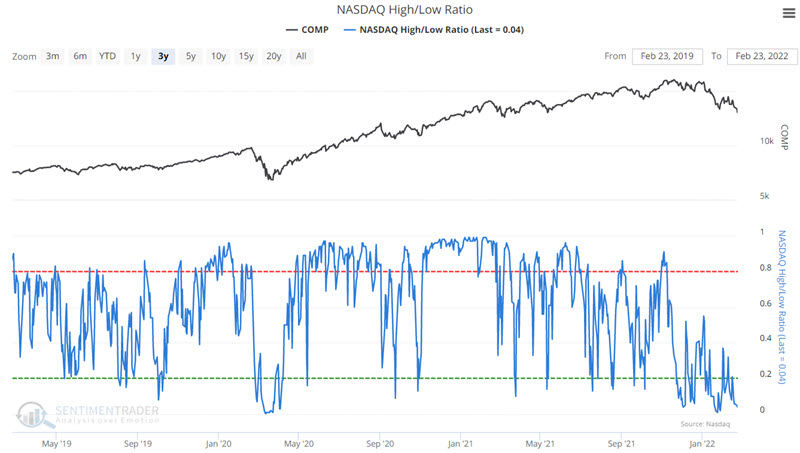
New highs are the number of NASDAQ issues that reached a new 52-week high today. New lows are the number of NASDAQ issues that reached a new 52-week low today. Jay looked at an indicator that is a breadth ratio constructed from these two values and is expressed as the number of issues that closed at a new high as a percentage of the total number of stocks making new highs or new lows.

The chart below displays the daily readings for the last three years. 

Nasdaq new high/low ratio is at an extreme

He then went on to construct a trading strategy using the recent extreme in this measure, and what kind of drawdown could be expected relative to prospective gains in the months ahead.

Stat box

Thursday marked only the 3rd time in the 40-year history of S&P 500 futures that there was a gap down open of more than 2%, falling to a 6-month low, then a reversal to close up by more than 1%. The others were July 24, 2002, and September 16, 2008.


Commodities continue to roll

Dean looked at the continued surge in commodities, using an absolute performance of a broad index, breadth within the commodity space, and returns relative to equities.

In a note published last October, Dean assessed the outlook for commodities when the 2-year rolling return for the Bloomberg Commodity Spot Index exceeds 50% for the first time. The 2-year rolling return continues to climb, which suggests the secular case for commodities remains constructive.

Commodities continue to surge

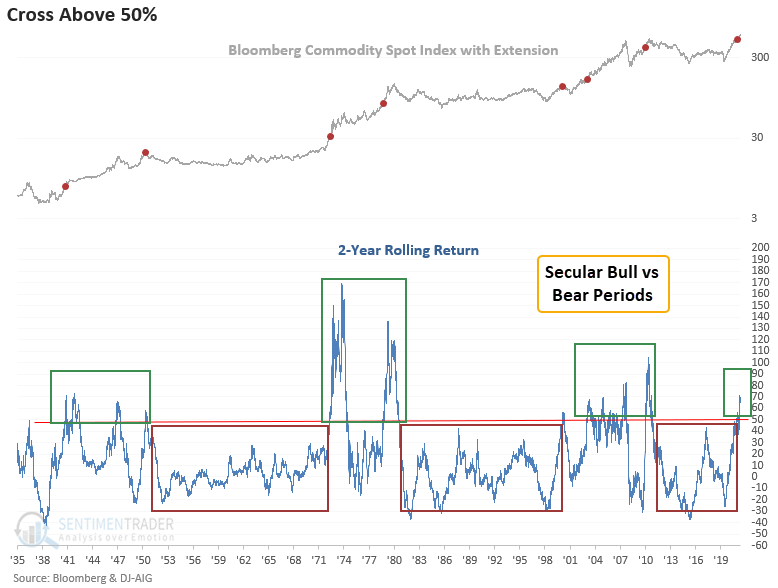
With the Bloomberg commodity spot index up 12% since the signal date, the odds of a 1951 or 2000 peak look less likely.

PRODUCTS
SentimenTrader
Trading Tools
Indicators & Data API
‍
Strategies & Scanner
‍
Research Reports
FREE
RESOUrCES
Simple Backtest
Calculator
Simple Seasonality
Calculator
The Kelly Criterion
Calculator
Sentiment Geo Map
‍
Public Research Reports
‍
Education
Sentiment Indicators
‍
Technical Indicators
‍
Pricing
Bundle pricing
‍
FAQ
‍
Announcements
‍
COMPANY
‍
About
‍
In the News
‍
Testimonials
‍
Client Success Stories
CONTACT
‍
General Inquiries
‍
Media Inquiries
‍
Financial Professionals Inquiries
‍
© 2025 Sundial Capital Research Inc. All rights reserved.
Setsail Marketing
TermsPrivacyAffiliate Program
Risk Disclosure: Futures and forex trading contains substantial risk and is not for every investor. An investor could potentially lose all or more than the initial investment. Risk capital is money that can be lost without jeopardizing ones’ financial security or life style. Only risk capital should be used for trading and only those with sufficient risk capital should consider trading. Past performance is not necessarily indicative of future results.

Hypothetical Performance Disclosure: Hypothetical performance results have many inherent limitations, some of which are described below. No representation is being made that any account will or is likely to achieve profits or losses similar to those shown; in fact, there are frequently sharp differences between hypothetical performance results and the actual results subsequently achieved by any particular trading program. One of the limitations of hypothetical performance results is that they are generally prepared with the benefit of hindsight. In addition, hypothetical trading does not involve financial risk, and no hypothetical trading record can completely account for the impact of financial risk of actual trading. for example, the ability to withstand losses or to adhere to a particular trading program in spite of trading losses are material points which can also adversely affect actual trading results. There are numerous other factors related to the markets in general or to the implementation of any specific trading program which cannot be fully accounted for in the preparation of hypothetical performance results and all which can adversely affect trading results.

Testimonial Disclosure: Testimonials appearing on this website may not be representative of other clients or customers and is not a guarantee of future performance or success.