Products
SentimenTrader Trading Tools
‍
Backtest Engine
My Trading Toolkit
Correlation Analysis
Seasonality
Indicators & Data API
‍
Proprietary Indicators & Charts
Market Data API
Strategies & Scanner
‍
50+ Trading Strategies
Smart Stock Scanner
Research Reports
‍
Research Solutions
Reports Library
Free Resources
Simple Backtest Calculator
Simple Seasonality Calculator
The Kelly Criterion Calculator
Sentiment Geo Map
Public Research Reports
Education
Sentiment Indicators
Technical Indicators
Pricing
Company
About
In the News
Testimonials
Client Success Stories
Contact
Log inLoginSign up
< BACK TO ALL REPORTS

Why the junk bond market is sending a historic signal

Jason Goepfert
2022-02-15
Selling pressure in high-yield bonds is nearing levels last seen in 2008 and 2020. Optimism toward Disney stock is starting to return.

High-yield bonds suffer historic selling pressure

Starting in November, we looked at suspect performance in high-yield bonds as a worrying sign. The Cumulative Advance/Decline Line was diverging as more and more bonds were declining even as stocks hit new highs. 

Bonds were trying to recover from mild oversold conditions, but there were concerns about its sustainability. It's gotten worse since then.

High yield junk bond advance decline line is diverging

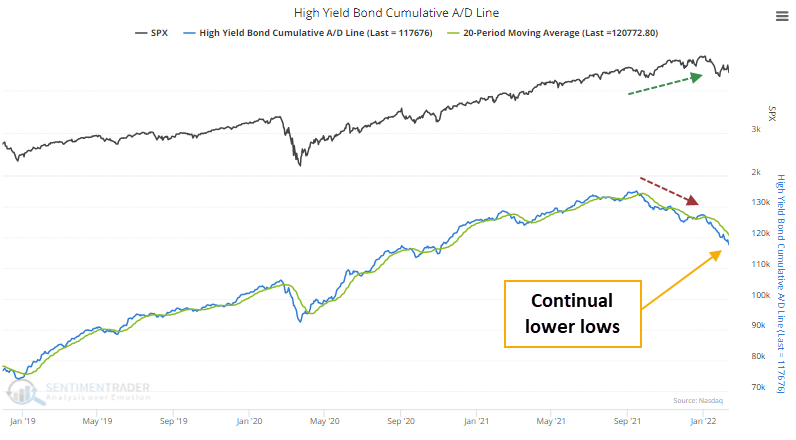
High-yield bonds made a comeback at the end of the year, but soon after, more bonds were falling to 52-week lows than rising to 52-week highs, a clear sign of risk-off behavior among some of the most sensitive and forward-looking investors.

About the only bright spot is that selling pressure has been so focused over the past month that we're nearing some historic extremes. A broad cross-section of indicators is showing broad selling pressure and widespread pessimism.

Stat box

Social media users have posted 4 times more bearish messages than bullish ones on the Dow Industrials ETF (DIA). There have been 18 other days when our Social Sentiment was above 4 on DIA, all of which happened to lead to positive returns over the next month.


Optimism is returning in Disney

Investor sentiment regarding Disney recently bottomed out and reversed higher. Jay noted that this action tends to resolve itself with Disney stock moving higher over the next six months.

The chart below displays each occasion since 1962 when the 50-day moving average for DIS Optix crossed above 36. You can run this test in the Backtest Engine.

Optimism on Disney is starting to turn higher

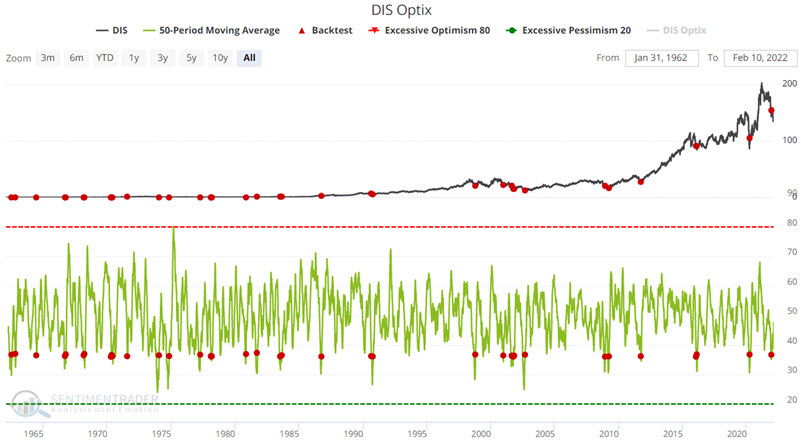
So, let's test out a strategy that waits two weeks after each signal before getting into Disney stock and then holds that position until six months after the signal. To emulate this approach, we will use the following rules:

  • Each time DIS 50-day Optix crosses above 36, we will wait ten trading days and then buy and hold for approximately 6 months.
  • If a new signal occurs while a previous signal is still active, the holding period is extended for another six months.

These rules resulted in 19 winning trades out of 22 instances.

PRODUCTS
SentimenTrader
Trading Tools
Indicators & Data API
‍
Strategies & Scanner
‍
Research Reports
FREE
RESOUrCES
Simple Backtest
Calculator
Simple Seasonality
Calculator
The Kelly Criterion
Calculator
Sentiment Geo Map
‍
Public Research Reports
‍
Education
Sentiment Indicators
‍
Technical Indicators
‍
Pricing
Bundle pricing
‍
FAQ
‍
Announcements
‍
COMPANY
‍
About
‍
In the News
‍
Testimonials
‍
Client Success Stories
CONTACT
‍
General Inquiries
‍
Media Inquiries
‍
Financial Professionals Inquiries
‍
© 2025 Sundial Capital Research Inc. All rights reserved.
Setsail Marketing
TermsPrivacyAffiliate Program
Risk Disclosure: Futures and forex trading contains substantial risk and is not for every investor. An investor could potentially lose all or more than the initial investment. Risk capital is money that can be lost without jeopardizing ones’ financial security or life style. Only risk capital should be used for trading and only those with sufficient risk capital should consider trading. Past performance is not necessarily indicative of future results.

Hypothetical Performance Disclosure: Hypothetical performance results have many inherent limitations, some of which are described below. No representation is being made that any account will or is likely to achieve profits or losses similar to those shown; in fact, there are frequently sharp differences between hypothetical performance results and the actual results subsequently achieved by any particular trading program. One of the limitations of hypothetical performance results is that they are generally prepared with the benefit of hindsight. In addition, hypothetical trading does not involve financial risk, and no hypothetical trading record can completely account for the impact of financial risk of actual trading. for example, the ability to withstand losses or to adhere to a particular trading program in spite of trading losses are material points which can also adversely affect actual trading results. There are numerous other factors related to the markets in general or to the implementation of any specific trading program which cannot be fully accounted for in the preparation of hypothetical performance results and all which can adversely affect trading results.

Testimonial Disclosure: Testimonials appearing on this website may not be representative of other clients or customers and is not a guarantee of future performance or success.