Products
SentimenTrader Trading Tools
‍
Backtest Engine
My Trading Toolkit
Correlation Analysis
Seasonality
Market Prediction
Indicators & Data API
‍
Proprietary Indicators & Charts
Market Data API
Strategies & Scanner
‍
50+ Trading Strategies
Smart Stock Scanner
Smart Option Scanner
Research Reports
‍
Research Solutions
Reports Library
Free Resources
Simple Backtest Calculator
Simple Seasonality Calculator
The Kelly Criterion Calculator
Sentiment Geo Map
Public Research Reports
Education
Sentiment Indicators
Technical Indicators
Pricing
Company
About
In the News
Testimonials
Client Success Stories
Contact
Log inLoginSign up
< BACK TO ALL REPORTS

Why the failed breadth thrust is not necessarily bad

Jason Goepfert
2022-09-06
Since a breadth thrust three weeks ago, the S&P 500 has traded down almost in a straight line. It has been the worst reaction to a breadth thrust in history. After other failed thrusts, the S&P showed a strong tendency to rebound as investors who missed the thrust saw their chance for a bargain.

Key points:

  • Three weeks after a massive breadth thrust, the S&P 500 has suffered large losses
  • The reaction to the latest thrust was the worst in history
  • After other failed thrusts, the S&P showed a strong tendency to rebound

Three weeks after a breadth thrust, nothing but losses

Three weeks ago, buyers were so interested in owning stocks that they bought pretty much all of them.

Within the S&P 500, more than 90% of stocks traded above their 50-day moving averages, after fewer than 5% of them did in June. When a similar thrust occurred in the spring of 2020, buyers continued to push the index higher over the next few weeks. This time, it has been an almost immediate failure.

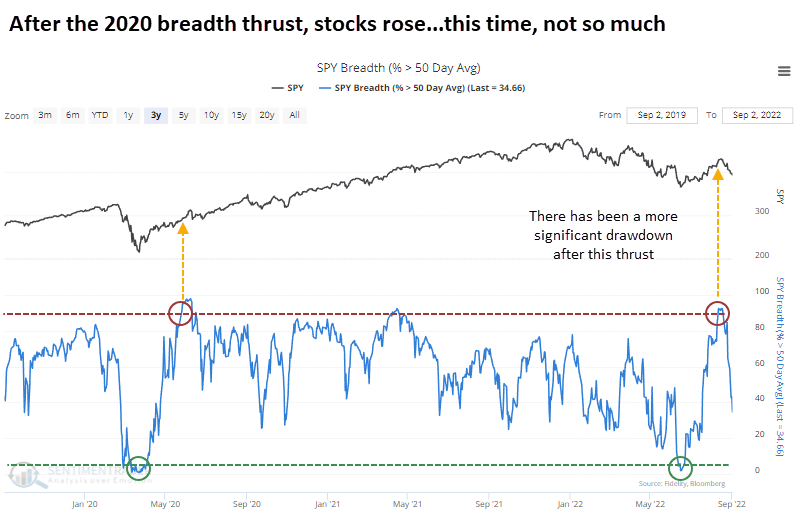
The thrust was triggered on August 12 when more than 90% of S&P 500 stocks traded above their 50-day moving average. In the three weeks since then, the S&P index rallied only +0.6% above the August 12 close and fell as much as -8.3%. 

This is the worst three-week reaction in the history of breadth thrusts. Ouch.

Classic technical analysis would suggest that this is an ominous sign. But we don't have much use for "classic technical analysis" because much of it is grounded in superstitions, anecdotes, and arbitrary rules. If we instead look at the evidence, we can see that it hasn't been as ominous as we might assume.

Failed breadth thrusts have not been a dire signal

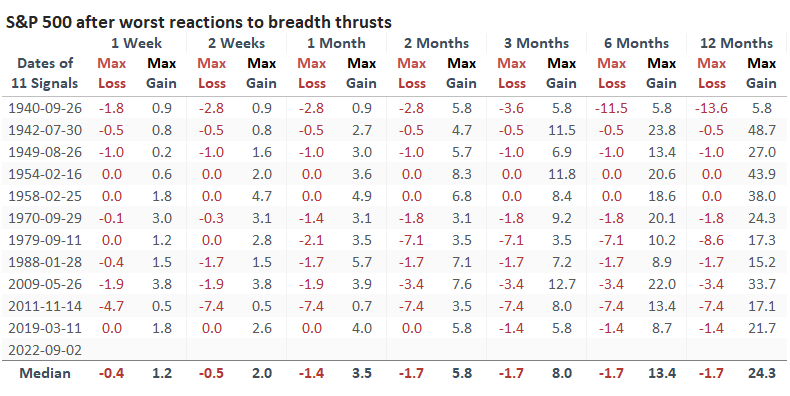
The table below shows the worst three-week reactions to similar breadth thrusts since 1928. These are times when fewer than 5% of S&P stocks were trading above their 50-day average, then more than 90% of them did. In the following three weeks, the index showed the worst reactions, with the smallest gains and largest drawdowns.

Curiously, only one signal, in 1940, showed persistent losses in the months ahead. After the others, the S&P 500 rebounded, and its gains were usually significant.

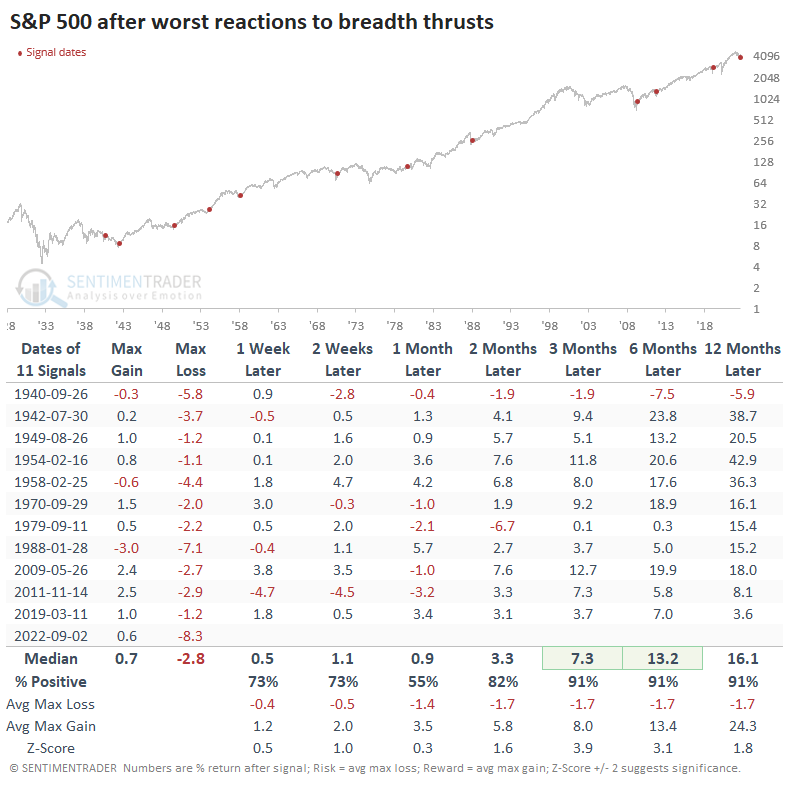
The Risk/Reward Table shows that within the next three months, only two signals suffered a drawdown of more than -5%. All but one of them enjoyed a gain of more than +5% within that time frame.

Contrast this performance to those signals that showed the best reaction. These are times when the index rose the most and suffered the smallest drawdown in the three weeks following a thrust.

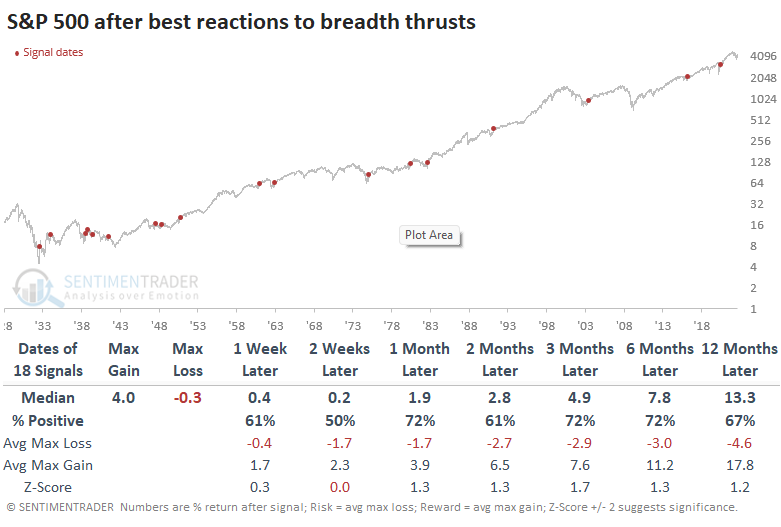
After most time frames, the S&P showed less consistent gains, smallest gains, larger drawdowns, and smaller maximum gains.

What the research tells us...

The ridicule being heaped on the multiple breadth thrusts since June has reached a fever pitch. Because stocks have declined, it seems like everyone is discounting the signals and marking them down in the "failure" column. They certainly have failed so far; that is objectively true. But it also missed the point because they are not consistent short-term signals. Instead, they are guides that longer-term sentiment has shifted, and investors are now willing to buy stocks eagerly. That sentiment tends to persist for months.

PRODUCTS
SentimenTrader
Trading Tools
Indicators & Data API
‍
Strategies & Scanner
‍
Research Reports
FREE
RESOUrCES
Simple Backtest
Calculator
Simple Seasonality
Calculator
The Kelly Criterion
Calculator
Sentiment Geo Map
‍
Public Research Reports
‍
Education
Sentiment Indicators
‍
Technical Indicators
‍
Pricing
Bundle pricing
‍
FAQ
‍
Announcements
‍
COMPANY
‍
About
‍
In the News
‍
Testimonials
‍
Client Success Stories
CONTACT
‍
General Inquiries
‍
Media Inquiries
‍
Financial Professionals Inquiries
‍
© 2026 Sundial Capital Research Inc. All rights reserved.
Setsail Marketing
TermsPrivacyAffiliate Program
Risk Disclosure: The information and tools provided are for research and analytical purposes only and are not intended as investment advice. Market analysis involves uncertainty, and outcomes may differ from expectations. Users should conduct their own due diligence and consider their individual circumstances before making any financial decisions. Past performance is not necessarily indicative of future results.

Hypothetical Performance Disclosure: Hypothetical performance results have many inherent limitations, some of which are described below. No representation is being made that any account will or is likely to achieve profits or losses similar to those shown; in fact, there are frequently sharp differences between hypothetical performance results and the actual results subsequently achieved by any particular trading program. One of the limitations of hypothetical performance results is that they are generally prepared with the benefit of hindsight. In addition, hypothetical trading does not involve financial risk, and no hypothetical trading record can completely account for the impact of financial risk of actual trading. for example, the ability to withstand losses or to adhere to a particular trading program in spite of trading losses are material points which can also adversely affect actual trading results. There are numerous other factors related to the markets in general or to the implementation of any specific trading program which cannot be fully accounted for in the preparation of hypothetical performance results and all which can adversely affect trading results.

Testimonial Disclosure: Testimonials appearing on this website may not be representative of other clients or customers and is not a guarantee of future performance or success.