
Why SPY may dip, and a strategy for buying it

Indexes shrug off weak internals
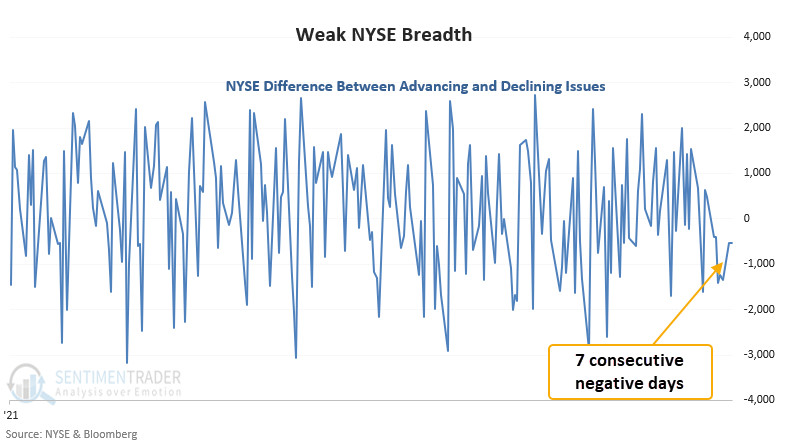
The NYSE registered 7 consecutive days with more declining issues than advancing issues, even while the S&P 500 was 0.29% below a 252-day high heading into Friday's carnage.
Similar streaks of negative breadth near a high have suggested a pause when it has triggered in the past.
For only the 6th time since 1926, declining issues outnumbered advancing issues for 7 consecutive days when the S&P 500 closed 2% or less from its 252-day high. There were 123 days that triggered if we ignore how far the S&P was trading from its peak. Almost half of those signals occurred when the S&P 500 was down 10% or more from its 252-day high.
While the sample size is painfully small, we looked at the other instances to determine the typical time it took for weakness in stocks to play out.

| Stat box Despite a nearly 2% loss on Friday, traders moved more than $500 million into the Nasdaq 100 Trust (QQQ) on Friday. That's the 14th time this year that tech investors have aggressively bought the dip. |
Buying a pullback in an uptrend
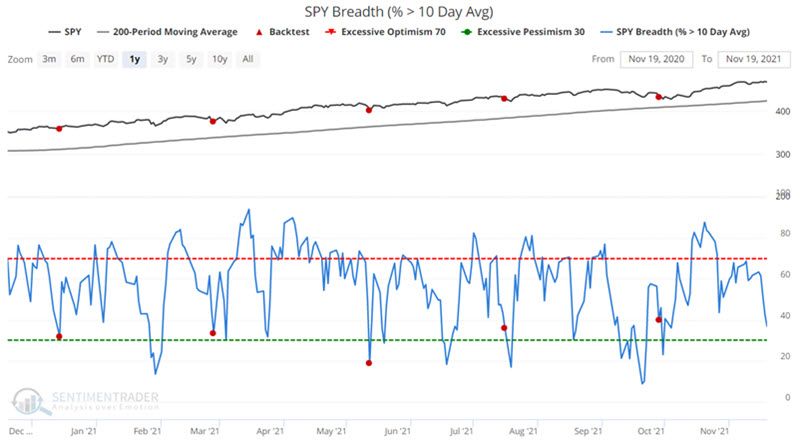
Let's consider the potential for using a simple breadth-based indicator to play the long side using shares of ETF ticker SPY (SPDR S&P 500 ETF Trust ).
We will look for times when SPY is above its 200-day moving average and then fewer than 40% of its member stocks are trading above their 10-day moving averages for the first time in 2 months. The first condition filters for an objective "uptrend." The second condition objectively identifies a pullback in the overall index.
There is no shortage of trading signals since SPY's inception.
If we bought SPY after every signal and held for 2 months, the cumulative hypothetical growth of $1 since 1998 appears below.
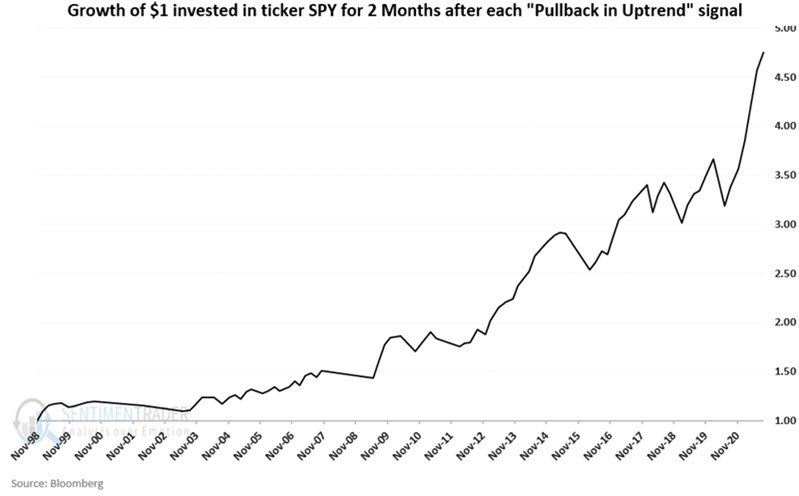
The strategy is not the "be all, end all" of trading systems and can undoubtedly be improved. But note also what it does demonstrate - that a simple "buy the dips in an uptrend" approach to trading can be consistently profitable over time.
