
Why semiconductors matter

Key points
- The semiconductor sector is considered by many to be something of a bellwether for the overall stock market
- The theory is that the overall stock market tends to perform better when the semiconductor industry is outperforming the overall market
- We put that theory to the test in the information below
Semiconductors versus the broader market
Not every indicator is meant to be used as a standalone trading model, i.e., generating specific and automatic buy and sell signals. Some indicators are best used as weight of the evidence. Specifically, when the indicator is deemed bullish, it is presumed that there is a higher probability that the overall market is on a bullish trend and vice versa. The relationship between the semiconductor industry and the S&P 500 offers a case in point.
Our operating theory for this test is that the S&P 500 index should perform better when the semiconductor sector outperforms it than when the semiconductor sector underperforms it.
For our test, we will use weekly total return data for the S&P 500 Index (SPXT) and the Fidelity Electronics Select Sector mutual fund (FSELX) starting on 1988-01-08. FSELX was selected because it has a more extended history than ETFs, such as ticker SMH, but trades with a 98% correlation to SMH.
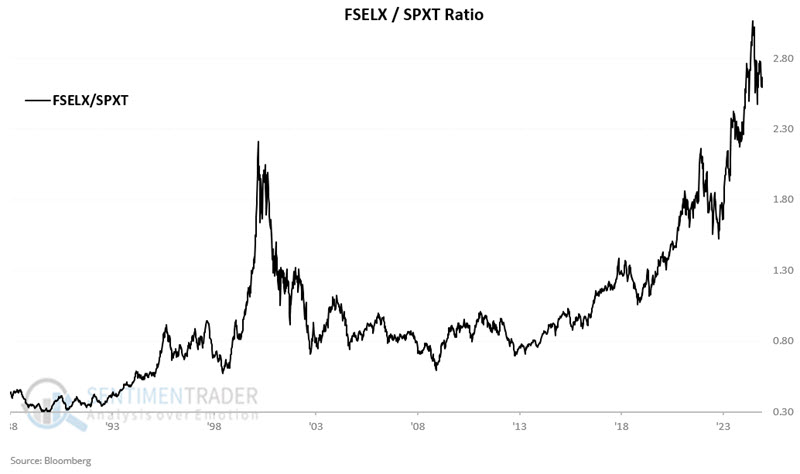
A = We divide FSELX by SPXT each week to get a relative ratio.
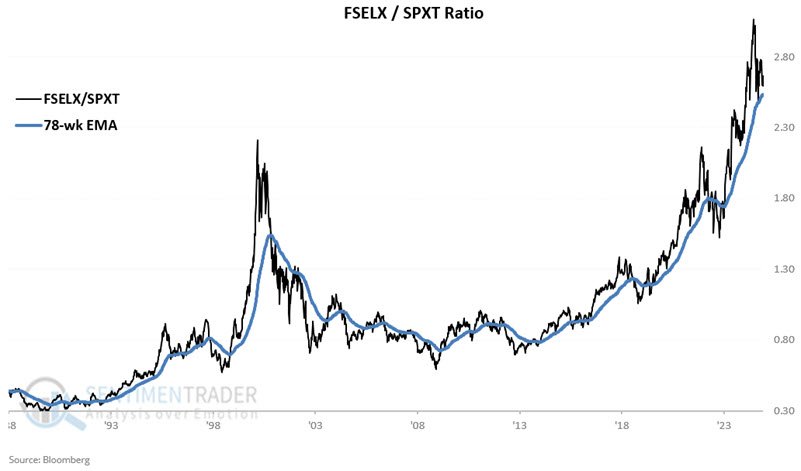
B = We will also calculate a 78-week (i.e., 1.5 years) exponential moving average of the ratio at the end of each week
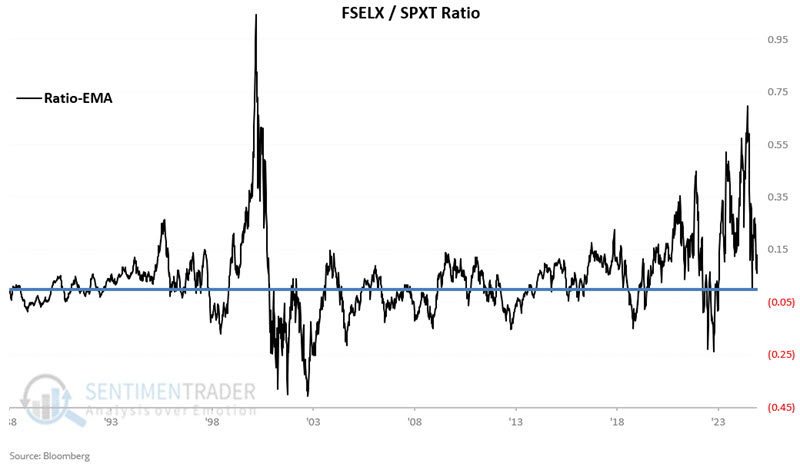
C = A - B
If C > 0, we deem the trend favorable
If C < 0 we deem the trend unfavorable
The chart below displays Variable A, the weekly FSELX/SPXT ratio
The chart below also adds Variable B, the 78-week EMA.
Finally, the chart below subtracts Variable B from Variable A and arrives at Variable C.
Testing favorable versus unfavorable readings
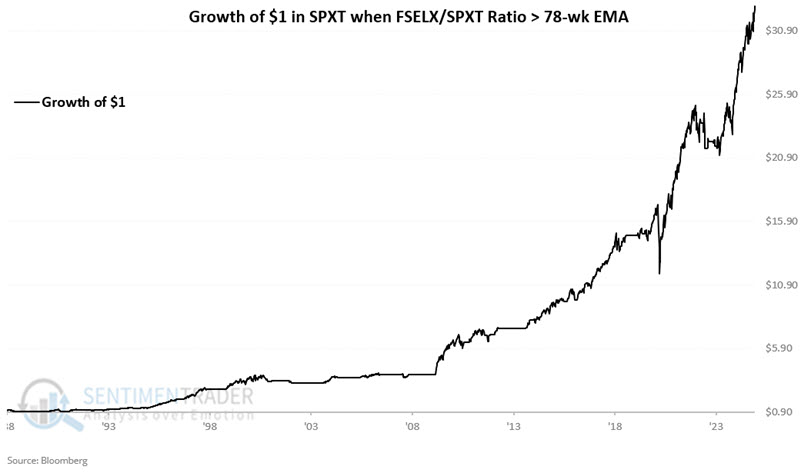
We consider the trend to be favorable when Variable C is positive. The chart below displays the hypothetical growth of $1 invested in SPXT only when Variable C is positive.
The chart below displays the same data using a logarithmic scale.
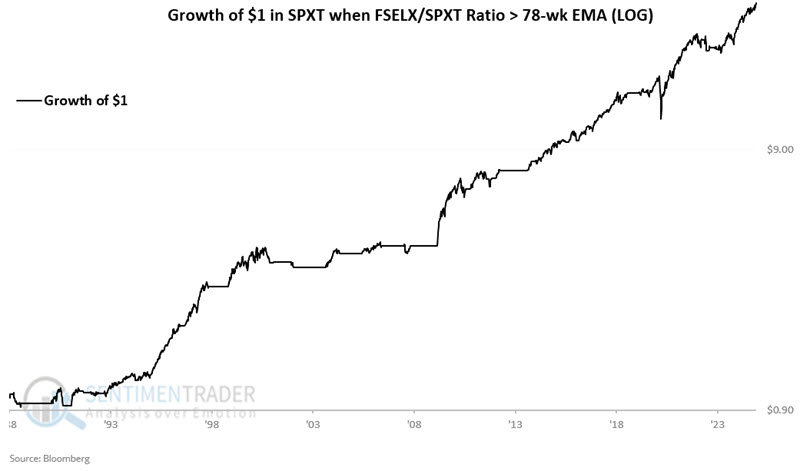
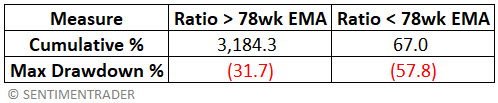
The hypothetical net gain since 1988, when this indicator is deemed favorable, is +3,184%. As importantly, note the lack of prolonged and deep bear market declines.
Let's examine the S&P 500's performance when the FSELX/SPXT Ratio is below its 78-week EMA (i.e. when Variable C is negative). The chart below displays the hypothetical growth of $1 invested in SPXT only when Variable C is negative.
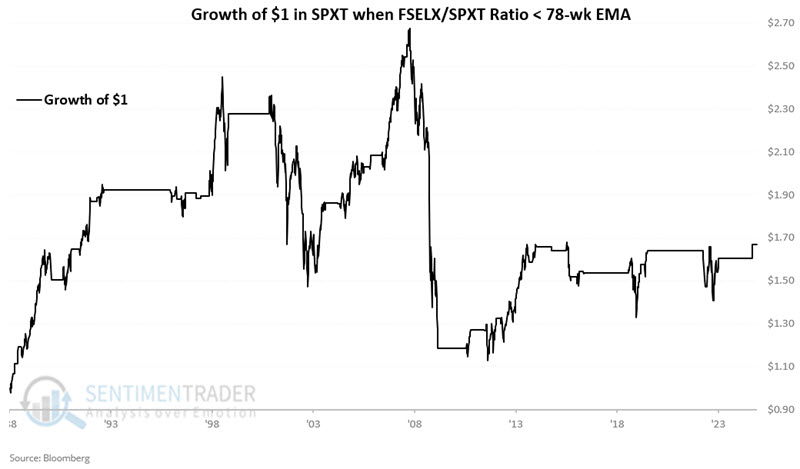
Two things to note. First, the chart above has shown a gain of 67% since 1988. So, it would be technically incorrect to deem this "bearish." That said, no new money has been made since 1991.
Next, let's consider equity drawdowns during favorable and unfavorable periods. The chart below displays the percentage drawdowns for favorable (black line) and unfavorable (blue line) periods.
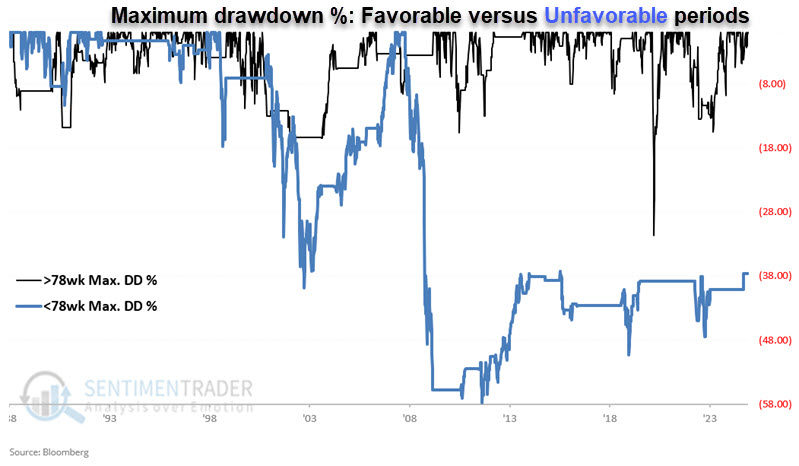
Three favorable periods have had drawdowns greater than -15% and a maximum drawdown (during the COVID selloff in 2020) of -31.7%. At their worst, unfavorable periods suffered a maximum drawdown of -57.8%.
The table below summarizes what we have seen so far.
Digging a little deeper
Next, look at the S&P 500's weekly performance depending on whether the FSELX/SPXT Ratio is above or below its 78-week EMA. The table below summarizes weekly SPXT performance during all "favorable" weeks versus all "unfavorable" weeks.
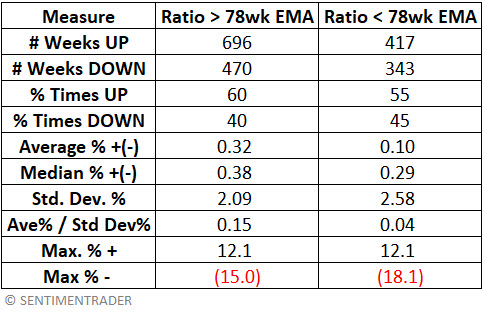
The table above shows weekly results favoring favorable periods in terms of Win Rate, Average and Median returns, and Average returns divided by Standard Deviation (i.e., risk-adjusted returns).
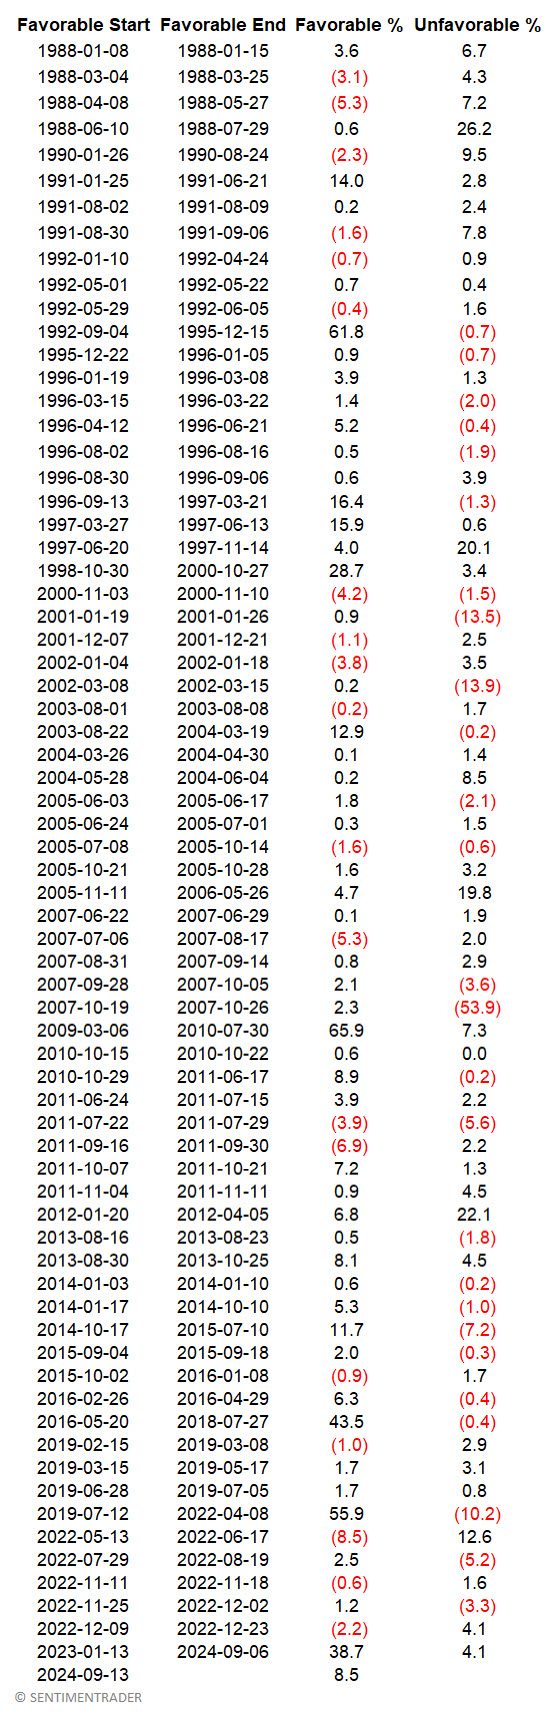
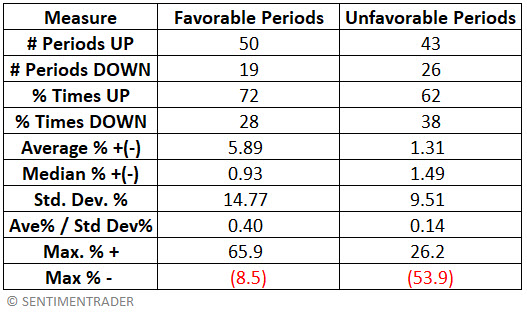
Finally, considering returns during each completed favorable and unfavorable period since 1988, we see the results below using S&P 500 total return data.
 The table below summarizes performance for favorable versus unfavorable periods.
What the research tells us…
Does the FSELX/SPXT ratio have value as a standalone trading model? That determination is in the eye of the beholder. That, however, is not the argument being made here. The question is, "Does the semiconductor industry have value as a market bellwether?" The answer to that question (using FSELX as a proxy for the semiconductor industry) appears to be "Yes" - i.e., the broader market (as measured by SPXT) tends to perform better when semiconductors are outperforming.