Products
SentimenTrader Trading Tools
‍
Backtest Engine
My Trading Toolkit
Correlation Analysis
Seasonality
Indicators & Data API
‍
Proprietary Indicators & Charts
Market Data API
Strategies & Scanner
‍
50+ Trading Strategies
Smart Stock Scanner
Research Reports
‍
Research Solutions
Reports Library
Free Resources
Simple Backtest Calculator
Simple Seasonality Calculator
The Kelly Criterion Calculator
Sentiment Geo Map
Public Research Reports
Pricing
Company
About
In the News
Testimonials
Client Success Stories
Contact
Log inLoginSign up
< BACK TO ALL REPORTS

Why Monday's Decline Was So Shocking

Jason Goepfert
2021-09-22
Based on the percentage change, Monday's session qualified as a shocking loss.

It's no secret that investors had become accustomed to a historic level of calm. We've been looking at this since the spring, it usually doesn't last, and yet it did for months.

Even with a late-day recovery on Monday, the loss in the most widely-benchmarked index in the world was a rude awakening to those who believe that stocks only travel in one direction. Monday's session was more than two standard deviations from the average daily change over the past year. The only other day with a -2 z-score over the past year was May 12, which marked the bottom for that pullback.

S&P 500 1 year z score

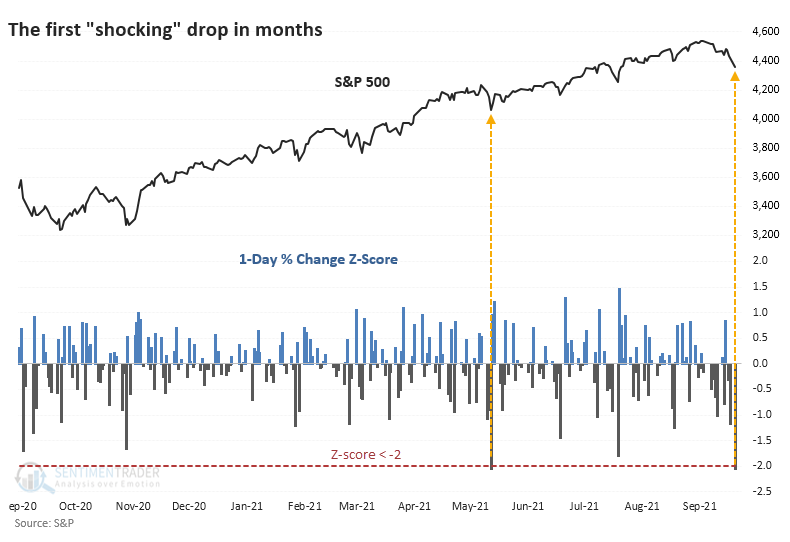
It had been nearly 90 days since that "shocking" decline in May, which is a relatively long time. Over the past decade, this ranked as the 10th-longest stretch between shocking drops.

Most of us are concerned with the question of "so what?" To help give a clue, the table below shows every time since 1928 when the S&P 500 was within 5% and no more than three weeks removed from a multi-year high, then suffered its first -2 standard deviation move in at least four months. These show the times when reality paid investors an unwelcome visit.


What else we're looking at

  • Full returns after stocks suffer a shocking drop
  • What the risk/reward of all precedents suggest about the coming week(s)
  • Potentially ways to manage a couple of options trades that are now profitable
  • A quick update on copper
  • Looking at several mean reversal signals that have set up (but not yet triggered)

Stat box

Put option trading volume in equities and indexes across U.S. exchanges neared 22 million contracts on Monday. That was the 6th-highest reading in the past 5 years.

Etcetera

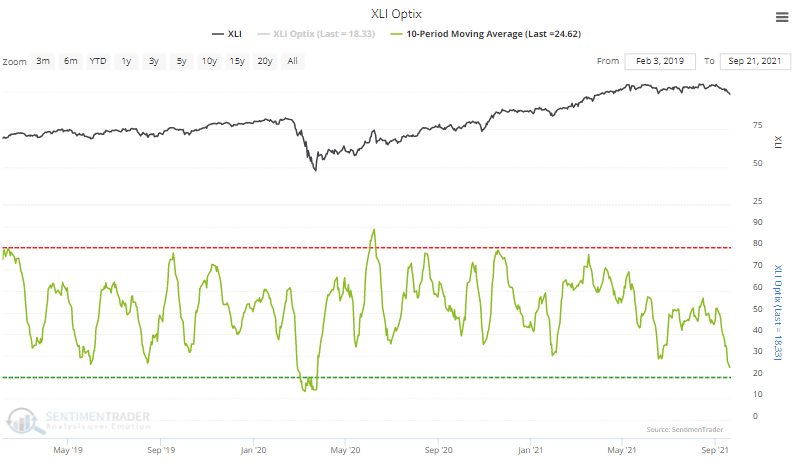
Heavy industry. Recent losses are weighing on sentiment in industrial stocks. Over the past 10 days, the average Optimism Index on the XLI Industrials fund has been below 25%, the 2nd-lowest in two years. These stocks tend to do well once sentiment starts to recover from a very low level.

xli industrial sentiment optimism index

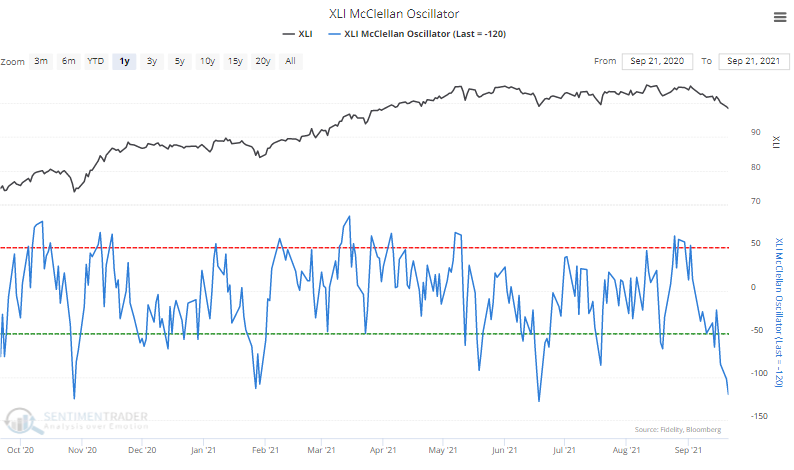
Oscillators oscillate. The McClellan Oscillator for industrial stocks has plunged below -100, showing quick and severe internal selling pressure. It was above +50 as recently as the end of August. The current reading is on par with the most severe reactions in the past year.

xli industrial mcclellan oscillator

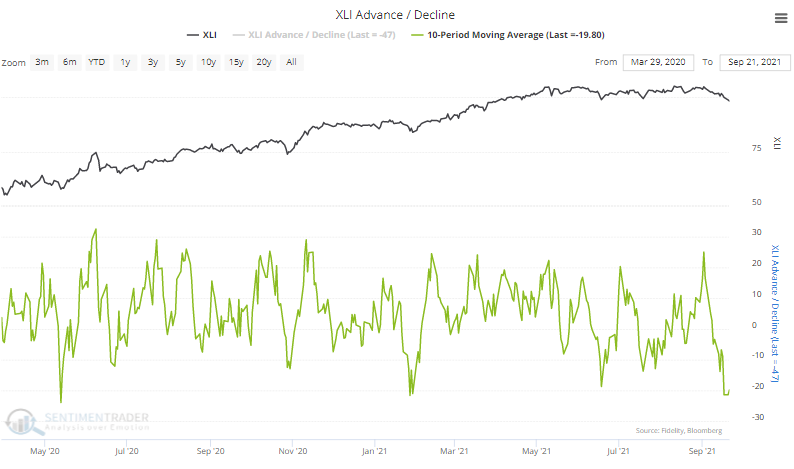
Sell (almost) everything. Heavy selling pressure is also evident in the 10-day advance/decline line for industrials. It's showing an average of nearly 20 more stocks declining than advancing, nearing the most lopsided selling pressure since the pandemic crash.

xli industrial advance decline line

PRODUCTS
SentimenTrader
Trading Tools
Indicators & Data API
‍
Strategies & Scanner
‍
Research Reports
FREE
RESOUrCES
Simple Backtest
Calculator
Simple Seasonality
Calculator
The Kelly Criterion
Calculator
Sentiment Geo Map
‍
Public Research Reports
‍
Pricing
Bundle pricing
‍
Announcements
‍
FAQ
COMPANY
‍
About
‍
In the News
‍
Testimonials
‍
Client Success Stories
CONTACT
‍
General Inquiries
‍
Media Inquiries
‍
Financial Professionals Inquiries
‍
© 2025 Sundial Capital Research Inc. All rights reserved.
Setsail Marketing
TermsPrivacyAffiliate Program
Risk Disclosure: Futures and forex trading contains substantial risk and is not for every investor. An investor could potentially lose all or more than the initial investment. Risk capital is money that can be lost without jeopardizing ones’ financial security or life style. Only risk capital should be used for trading and only those with sufficient risk capital should consider trading. Past performance is not necessarily indicative of future results.

Hypothetical Performance Disclosure: Hypothetical performance results have many inherent limitations, some of which are described below. No representation is being made that any account will or is likely to achieve profits or losses similar to those shown; in fact, there are frequently sharp differences between hypothetical performance results and the actual results subsequently achieved by any particular trading program. One of the limitations of hypothetical performance results is that they are generally prepared with the benefit of hindsight. In addition, hypothetical trading does not involve financial risk, and no hypothetical trading record can completely account for the impact of financial risk of actual trading. for example, the ability to withstand losses or to adhere to a particular trading program in spite of trading losses are material points which can also adversely affect actual trading results. There are numerous other factors related to the markets in general or to the implementation of any specific trading program which cannot be fully accounted for in the preparation of hypothetical performance results and all which can adversely affect trading results.

Testimonial Disclosure: Testimonials appearing on this website may not be representative of other clients or customers and is not a guarantee of future performance or success.