
Why it may be time to consider the short side of oil

Key points
- Crude oil has traded sideways for over two years
- The most heavily traded oil ETF is entering a period of seasonal weakness
- Traders should remain alert for an opportunity to play the short side
A closer look at crude oil seasonality
As the old saying goes, "Seasonality is climate, not weather." That climate is looking dicey for oil.
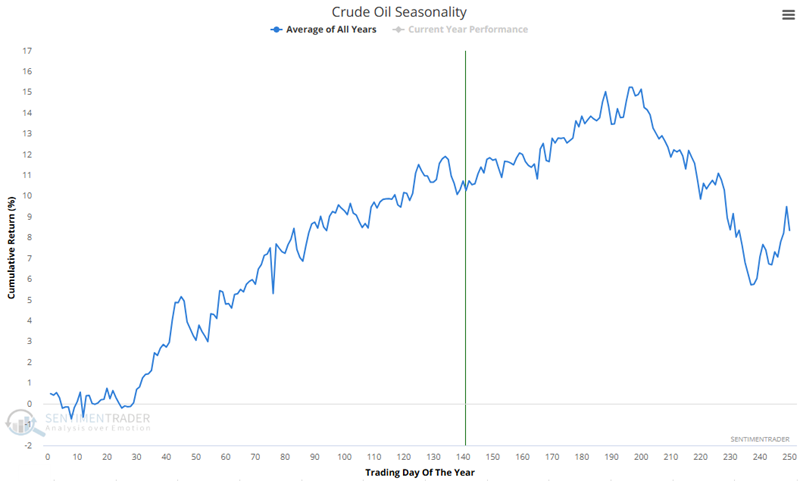
The chart below displays the Annual Seasonal Trend for crude oil futures. A glance suggests that seasonality could remain a favorable factor for a while longer.
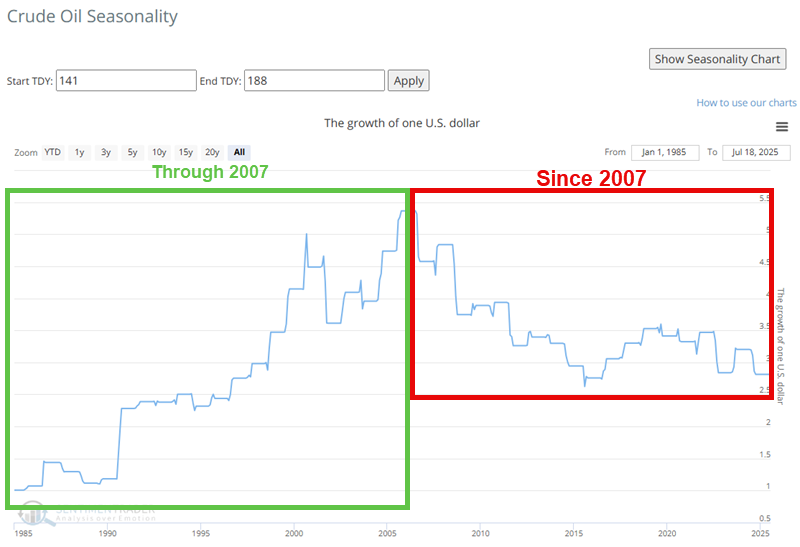
The chart below displays the hypothetical growth of $1 invested in crude oil during Trading Day of the Year (TDY) #141 through #188 each year since 1985. This period was mostly favorable through 2007, but has shown considerable weakness ever since.
Let's look at the potential for a trading opportunity in the United States Oil Fund (USO) in the months ahead. A trader looking for a bearish opportunity could consider trading options on USO or selling short shares of USO.
A closer look at USO and seasonality
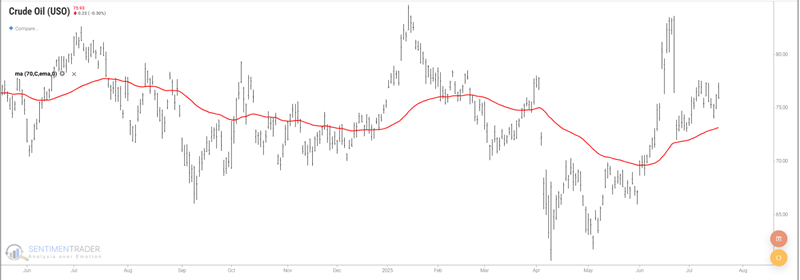
The chart below displays USO's recent price action. Note that shares are trading above the 70-day exponential moving average (EMA). While there is nothing magic about a 70-day EMA, it is a reasonable period for designating the trend as favorable or unfavorable, depending on whether the price is above or below this average.
The chart below displays the Annual Seasonal Trend for USO since its inception in 2006. The last six months of the year all show a negative average return.
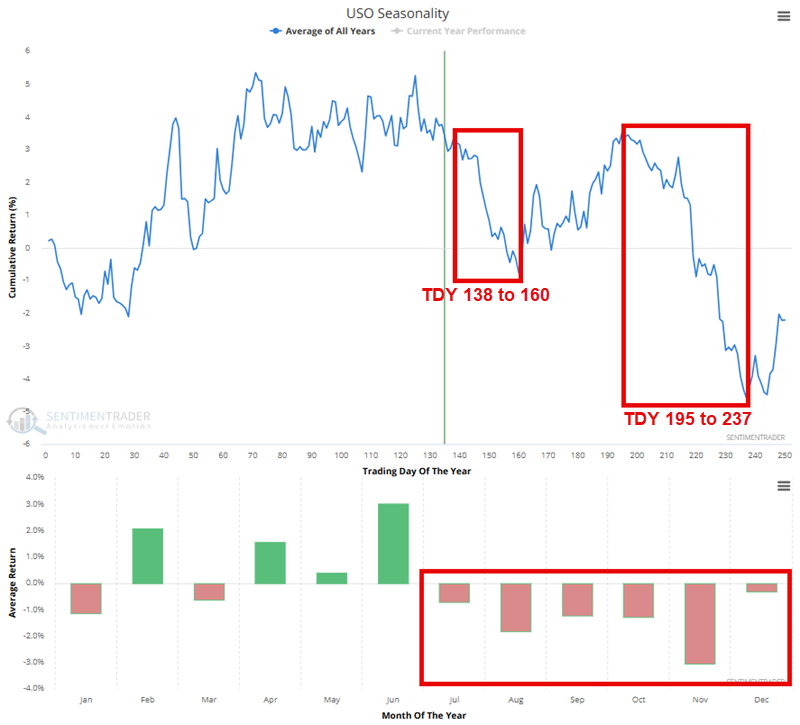
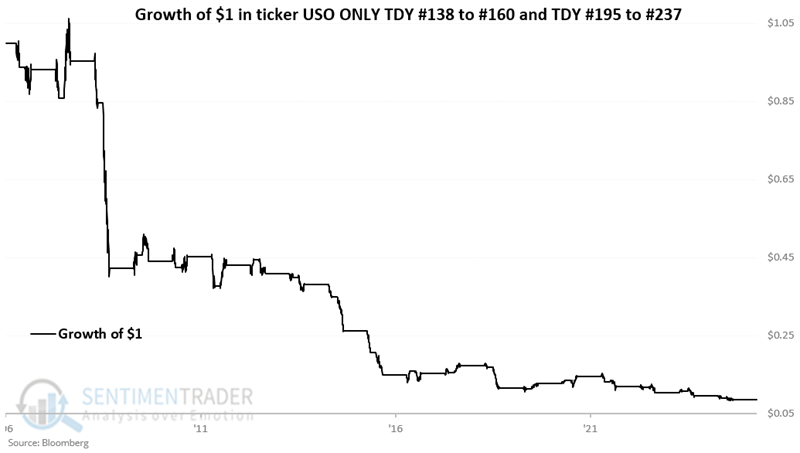
Also note the two periods highlighted - TDY #138 through #160 and TDY #195 through #237.
For 2025, the first unfavorable seasonal period extends from 2025-07-23 through 2025-08-22, and the second unfavorable period extends from 2025-10-13 through 2025-12-11.
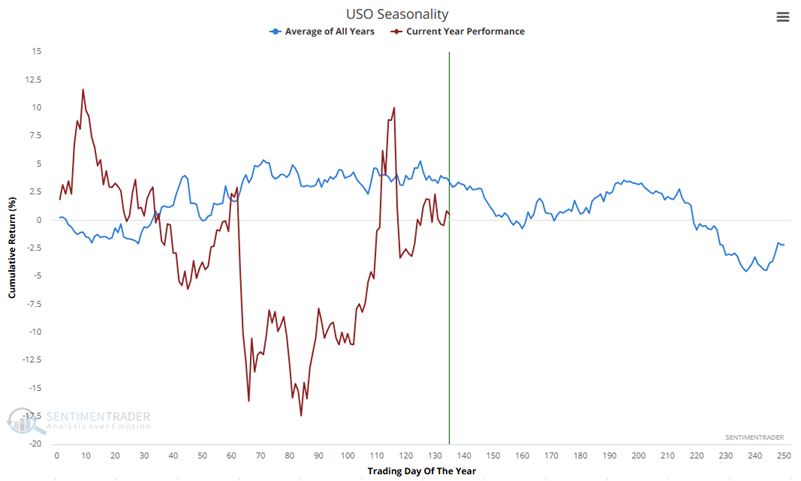
The chart below displays the actual price action for USO in 2025 (red line) versus the annual seasonal trend (blue line). It hasn't followed its typical trend too closely this year.
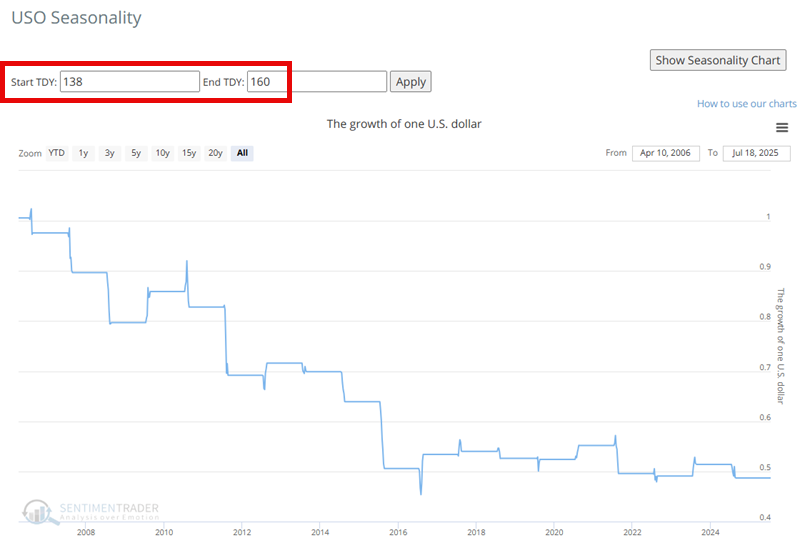
The first unfavorable period
The chart below displays the hypothetical growth of $1 invested in USO only from TDY #138 through #160 every year since 2006. The cumulative result was a 53% decline.
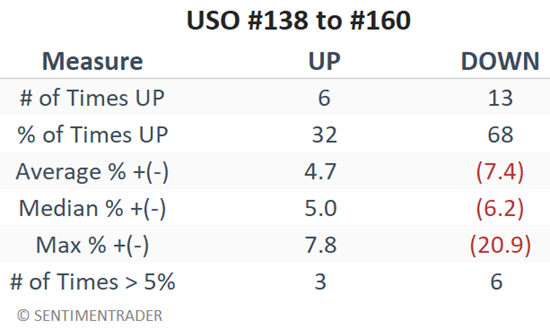
The table below summarizes USO's performance during this period. It rallied only 32% of the time while suffering a significantly larger average loss than average gain and a greater tendency to see a large loss than a large gain.
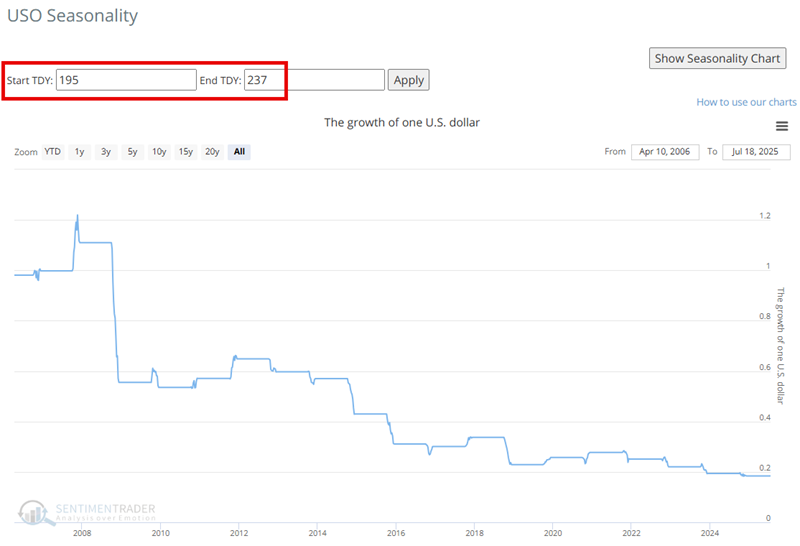
The second unfavorable period
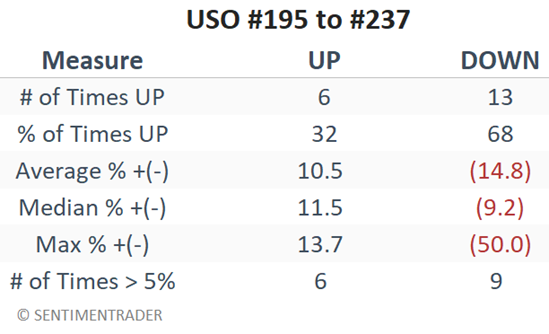
The chart below displays the hypothetical growth of $1 invested in USO only from TDY #195 through #237 every year since 2006. The cumulative result was an 82% decline.
The table below summarizes USO performance during this period. Once again, USO rallied only 32% of the time during these windows, with a larger average loss than gain.
Now, let's combine the two unfavorable periods. Holding a long position in USO only during these two seasonal windows and being flat the rest of the year resulted in a cumulative loss of 91%.
What the research tells us…
The price of crude oil can technically be considered favorable, based on USO shares trading above their 70-day EMA.
However, the history displayed in the charts and tables above strongly suggests that traders should watch closely during the second half of 2025 for opportunities to play the short side of crude oil, with USO being a viable vehicle. Aggressive traders could consider a play to the short side anytime during the two seasonal periods detailed above, while less aggressive traders might want to wait for price action to confirm a downtrend.