Products
SentimenTrader Trading Tools
‍
Backtest Engine
My Trading Toolkit
Correlation Analysis
Seasonality
Indicators & Data API
‍
Proprietary Indicators & Charts
Market Data API
Strategies & Scanner
‍
50+ Trading Strategies
Smart Stock Scanner
Research Reports
‍
Research Solutions
Reports Library
Free Resources
Simple Backtest Calculator
Simple Seasonality Calculator
The Kelly Criterion Calculator
Sentiment Geo Map
Public Research Reports
Education
Sentiment Indicators
Technical Indicators
Pricing
Company
About
In the News
Testimonials
Client Success Stories
Contact
Log inLoginSign up
< BACK TO ALL REPORTS

Why do small stocks look so expensive?

Jason Goepfert
2020-07-08
The forward price/earnings ratio for the Russell 2000 is at a 25-year high, thanks to a large number of those stocks losing money.

By some measures, stocks have never been so expensive, especially smaller ones.

A lot of small companies lose money, and those are often not included when firms calculate metrics like price/earnings ratios. If we use forward earnings estimates from Bloomberg, then we can alleviate some of those issues. Even so, small stocks haven't been this pricey in 25 years.

Russell 2000 forward price earnings ratio

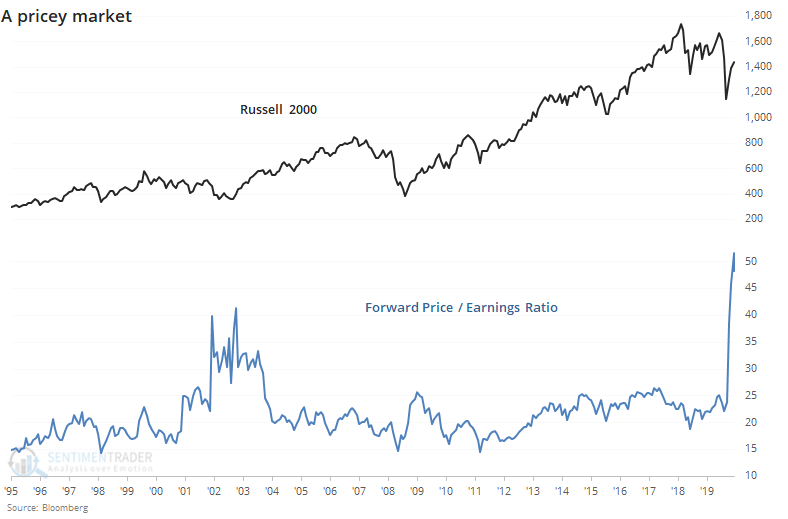
Granted, estimated earnings bring their own set of issues, especially now with uncertainty so high. The last time the forward P/E ratio for Russell 2000 stocks spiked above 40 was the bottom of the 2002 bear market, so this is not necessarily a reason to think stocks are expensive, just that uncertainty about profits is high.

As noted by Marketwatch:

"The reason these two firms report such low P/E ratios is that their calculations exclude firms that are losing money. In many years, this exclusion has little impact. But not now, since a significant percentage of the small- and mid-cap firms that are in the Russell 2000 index are losing money. By excluding those firms, the calculations artificially make the small- and mid-cap sectors appear significantly undervalued."

If we focus on that other issue, the fact that many of these companies are losing money, then it seems like a major negative. Only twice before in 20 years have such a high proportion of these small companies lost money, and as we see so often in markets, what seems true isn't necessarily so, because both times the Russell 2000 ended up rallying.


This is an abridged version of our recent reports and notes. For immediate access with no obligation, sign up for a 30-day free trial now.

We also looked at:

  • A look at the percentage of stocks in the Russell 2000 with negative operating earnings
  • What it means when the S&P 500 and Nasdaq rally at least 0.5% for 5 straight days
  • Copper is historically overbought - what that means for the metal, stocks, and commodities
  • Volume in SPY has dropped from well above average to well below
  • A lot of Taiwanese stocks are overbought
PRODUCTS
SentimenTrader
Trading Tools
Indicators & Data API
‍
Strategies & Scanner
‍
Research Reports
FREE
RESOUrCES
Simple Backtest
Calculator
Simple Seasonality
Calculator
The Kelly Criterion
Calculator
Sentiment Geo Map
‍
Public Research Reports
‍
Education
Sentiment Indicators
‍
Technical Indicators
‍
Pricing
Bundle pricing
‍
FAQ
‍
Announcements
‍
COMPANY
‍
About
‍
In the News
‍
Testimonials
‍
Client Success Stories
CONTACT
‍
General Inquiries
‍
Media Inquiries
‍
Financial Professionals Inquiries
‍
© 2026 Sundial Capital Research Inc. All rights reserved.
Setsail Marketing
TermsPrivacyAffiliate Program
Risk Disclosure: The information and tools provided are for research and analytical purposes only and are not intended as investment advice. Market analysis involves uncertainty, and outcomes may differ from expectations. Users should conduct their own due diligence and consider their individual circumstances before making any financial decisions. Past performance is not necessarily indicative of future results.

Hypothetical Performance Disclosure: Hypothetical performance results have many inherent limitations, some of which are described below. No representation is being made that any account will or is likely to achieve profits or losses similar to those shown; in fact, there are frequently sharp differences between hypothetical performance results and the actual results subsequently achieved by any particular trading program. One of the limitations of hypothetical performance results is that they are generally prepared with the benefit of hindsight. In addition, hypothetical trading does not involve financial risk, and no hypothetical trading record can completely account for the impact of financial risk of actual trading. for example, the ability to withstand losses or to adhere to a particular trading program in spite of trading losses are material points which can also adversely affect actual trading results. There are numerous other factors related to the markets in general or to the implementation of any specific trading program which cannot be fully accounted for in the preparation of hypothetical performance results and all which can adversely affect trading results.

Testimonial Disclosure: Testimonials appearing on this website may not be representative of other clients or customers and is not a guarantee of future performance or success.