Products
SentimenTrader Trading Tools
‍
Backtest Engine
My Trading Toolkit
Correlation Analysis
Seasonality
Indicators & Data API
‍
Proprietary Indicators & Charts
Market Data API
Strategies & Scanner
‍
50+ Trading Strategies
Smart Stock Scanner
Research Reports
‍
Research Solutions
Reports Library
Free Resources
Simple Backtest Calculator
Simple Seasonality Calculator
The Kelly Criterion Calculator
Sentiment Geo Map
Public Research Reports
Pricing
Company
About
In the News
Testimonials
Client Success Stories
Contact
Log inLoginSign up
< BACK TO ALL REPORTS

Why a low VIX is nothing to fear

Jay Kaeppel
2021-11-09
When the VIX recedes to the low end of its historical range, forward returns in the S&P 500 are below average, but with a lower standard deviation. That allows the index to grow in a slow, steady manner.

Key points:

  • The VIX "fear gauge" has been holding around or below 17 since mid-October
  • That's commonly believed to be a sign of complacency
  • Testing shows that a VIX below 17 allowed the S&P to grow steadily and consistently

Drawing a "line in the sand"

The chart below shows a monthly chart for the VIX Index with the 17 level as our cutoff between implied volatility being high or not.

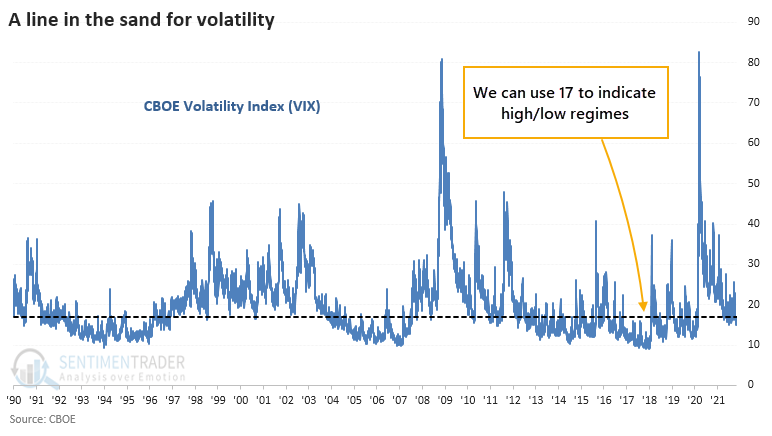
We will look at returns in the S&P 500 after 2 buckets:

  1. When the previous day ended with the VIX below 17
  2. When the previous day ended with the VIX at or above 17

Bear markets occur when VIX is above 17

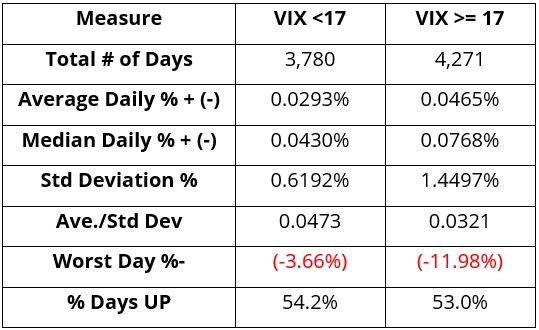
From January 1990 through the present, 3,780 trading days (47%) fell into Bucket #1, and 4,271 (53%) fell into Bucket #2. Trading days following VIX < 17 readings have:

  • Lower average and median daily returns
  • Much lower average volatility and downside
  • A slightly higher percentage of up days

Consider the statistics in the table below.

To get a better picture, the chart below displays the cumulative growth of $1 invested in the S&P 500 Index for trading days after VIX is above (blue) and below (black) 17.

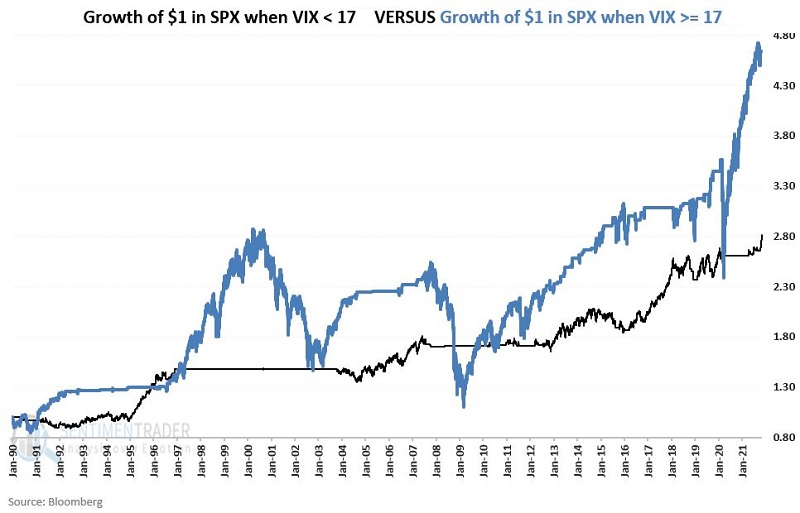
Days above 17 have a higher total return, but days below 17 are overall much less volatile. The bulk of the last 3 bear markets occurred when VIX > 17.

When VIX < 17, stocks compounded in a slow, steady way

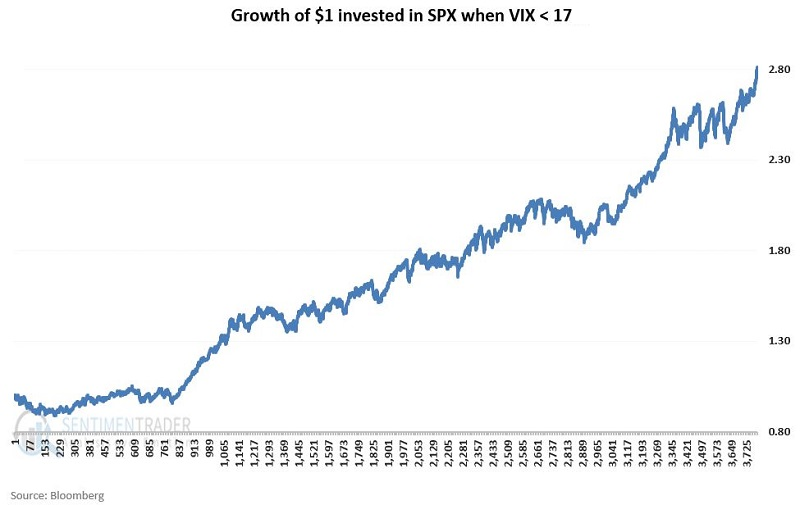
To test the argument that low VIX readings are worrisome for stocks, we will eliminate all days when VIX is >=17 and string together the performance for the S&P 500 Index only on days when VIX is < 17. 

The cumulative growth of $1 invested in the S&P 500 Index only when VIX < 17 appears in the chart below. There is a steady march from lower left to upper right. 

What the research shows…

The assertion that a low VIX reading is a warning sign to investors is misplaced. While returns may not be spectacular when VIX is < 17, they are surprisingly smooth, consistent, and non-volatile. Yes, the stock market can decline when VIX is < 17, but the mere existence of low implied options volatility among S&P 500 stocks does not appear to be a factor in creating market weakness.

Sorry, you don't have access to this report

Upgrade your subscription plan to get access
Go to Dasboard
PRODUCTS
SentimenTrader
Trading Tools
Indicators & Data API
‍
Strategies & Scanner
‍
Research Reports
FREE
RESOUrCES
Simple Backtest
Calculator
Simple Seasonality
Calculator
The Kelly Criterion
Calculator
Sentiment Geo Map
‍
Public Research Reports
‍
Pricing
Bundle pricing
‍
Announcements
‍
FAQ
COMPANY
‍
About
‍
In the News
‍
Testimonials
‍
Client Success Stories
CONTACT
‍
General Inquiries
‍
Media Inquiries
‍
Financial Professionals Inquiries
‍
© 2025 Sundial Capital Research Inc. All rights reserved.
Setsail Marketing
TermsPrivacyAffiliate Program
Risk Disclosure: Futures and forex trading contains substantial risk and is not for every investor. An investor could potentially lose all or more than the initial investment. Risk capital is money that can be lost without jeopardizing ones’ financial security or life style. Only risk capital should be used for trading and only those with sufficient risk capital should consider trading. Past performance is not necessarily indicative of future results.

Hypothetical Performance Disclosure: Hypothetical performance results have many inherent limitations, some of which are described below. No representation is being made that any account will or is likely to achieve profits or losses similar to those shown; in fact, there are frequently sharp differences between hypothetical performance results and the actual results subsequently achieved by any particular trading program. One of the limitations of hypothetical performance results is that they are generally prepared with the benefit of hindsight. In addition, hypothetical trading does not involve financial risk, and no hypothetical trading record can completely account for the impact of financial risk of actual trading. for example, the ability to withstand losses or to adhere to a particular trading program in spite of trading losses are material points which can also adversely affect actual trading results. There are numerous other factors related to the markets in general or to the implementation of any specific trading program which cannot be fully accounted for in the preparation of hypothetical performance results and all which can adversely affect trading results.

Testimonial Disclosure: Testimonials appearing on this website may not be representative of other clients or customers and is not a guarantee of future performance or success.