
Where we stand now in relation to the Mid-Decade Bulge

Key points
- If we step back and look at the stock market in terms of decades, specific patterns emerge
- Likely the most important pattern (referred to as "The Mid-Decade Bulge") is the tendency for stocks to perform well from late in "Year 2" into early "Year 6"
- We look below at this long-term tendency and where the market stands now in relation to this historical trend
The Mid-Decade Bulge: A favorable time of the decade (usually)
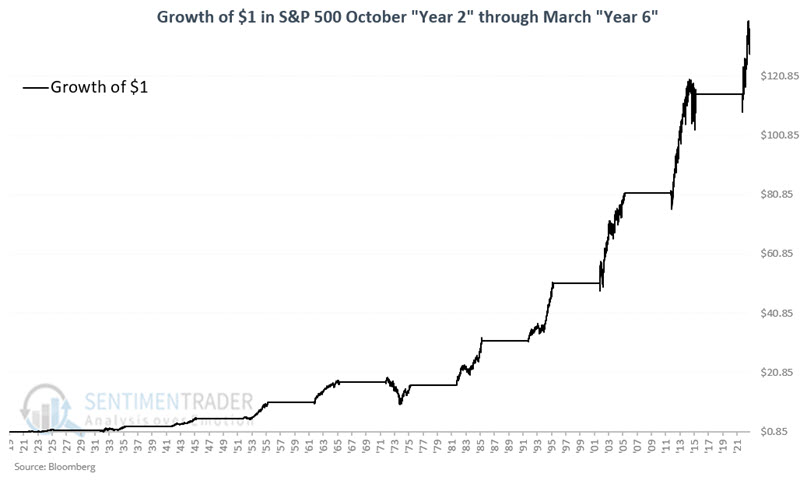
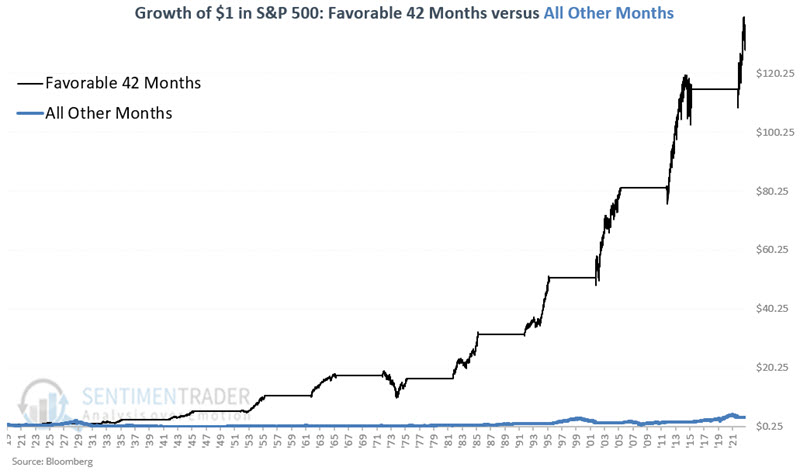
The period we will examine spans from the end of September of Year "2" through the end of March of Year "6". The chart below displays the growth of $1 invested only during these 42 months every decade starting in the 1920's. Through 2023-10-25, $1 invested in the S&P 500 only during the favorable 42 months of each decade grew to $124.28, or +12,328%.
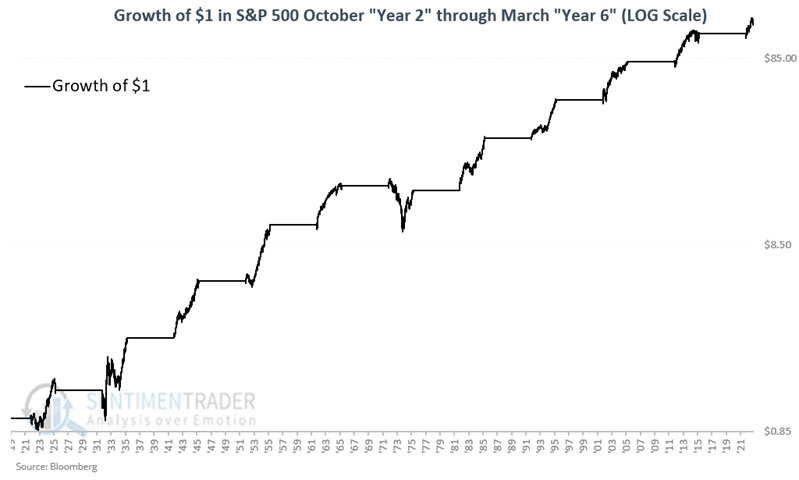
The chart below displays the same results on a logarithmic scale. While each 42-month favorable period inevitably has its ups and downs (with 1972 to 1976 as a major bear market outlier), the long-term favorable trend is unmistakable. For what it is worth, note in the upper right-hand corner that the most recent market decline barely registers as anything significant (though that is not to imply that it cannot or will not get worse).
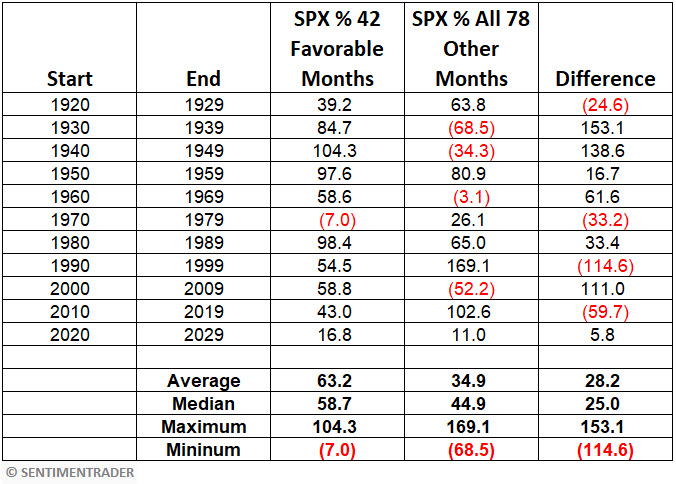
The table below displays results for the 42-month favorable period from each decade. Note that the current 42-month favorable period began at the close on 2022-09-30 and extends through 2026-03-31. Note that the last line of data in the table below measures from 2022-09-30 through 2023-08-25 results, and those values are not included in the calculations at the bottom of the table.
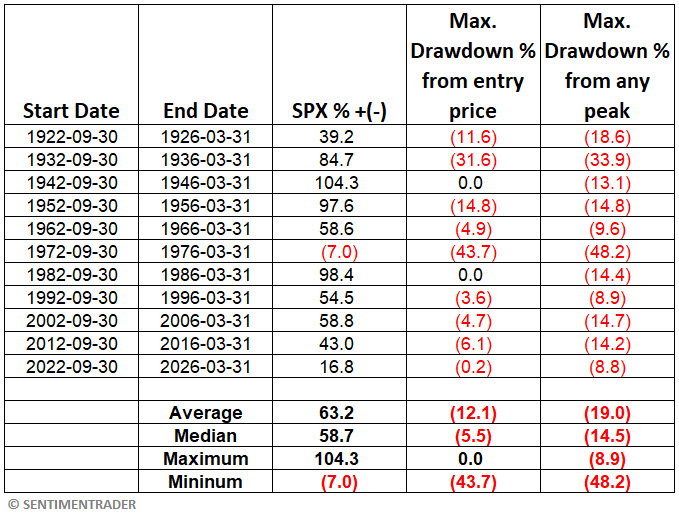
There are several things to note about this period:
- In 9 out of 10 decades, this period showed a gain
- The average gain was +63.2% or an annualized gain of +15.0%
- One decade (the 1970s) suffered a significant bear market, with a peak-to-valley drawdown of -43.7%
- The average maximum drawdown from the entry date (September 30th of Year 2) was -12.1%, with a median drawdown of -5.5%
- The average maximum drawdown from any peak between September 30th of Year 2 and March 31st of Year 6 was -19.0%, with a median drawdown of -14.5%
- Through 2023-08-25, the S&P 500 is +16.8% above its price on 2023-09-30 and the current peak-to-valley drawdown is -8.8%
Looking at All Other Months
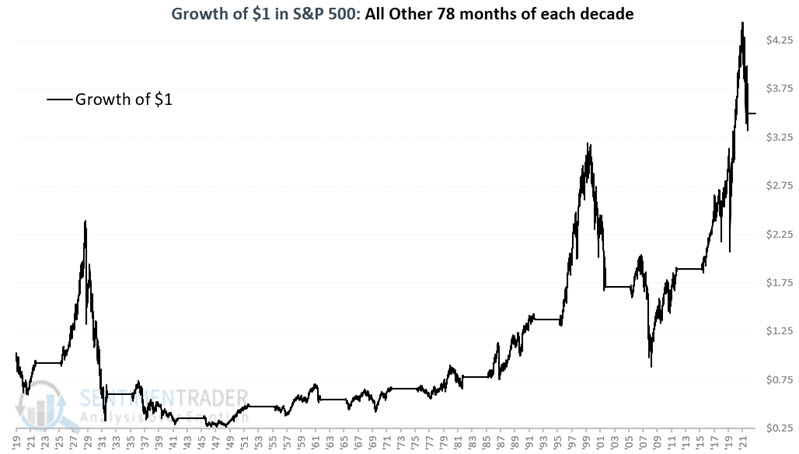
To put the results above into perspective, the chart below displays the growth of $1 invested in the S&P 500 Index during the other 78 months of each decade. Through 2023-10-25, $1 invested in the S&P 500 during all months, NOT including the favorable 42 months of each decade, grew to just $3.58, or +258%.
When we plot the two charts above together in the chart below, the growth of $1 for "All Other Months" hardly even registers. This illustrates the importance of trying to "make hay" in the market during the Mid-Decade Bulge.
There are 120 months in each decade. The table below compares the decade-by-decade S&P 500 performance during the 42 favorable month period each decade versus performance during All Other Months.
What the research tells us…
As always, there are never any guarantees in the stock market. While the seasonal pattern highlighted above is strong - and persistent - the performance in the 1970s reminds us that no seasonal pattern can be relied on 100%. Nevertheless, the +12,328% return during the favorable 42 months of each decade compared to the +258% return for the other 78 months of each decade reminds us of the importance of giving the bullish case the benefit of the doubt to whatever degree possible between now and 2026-03-31.