
Where inflation goes from here matters alot

Key Points
- CPI inflation has reached a relatively high level, historically speaking
- Extremes in inflation or deflation are overall a very unfavorable factor for the stock market
- However, where inflation goes next is of significant importance to overall market performance
CPI Inflation Calculation
I have my own way of following inflationary trends, so let's explain that first. The first thing to note is that I "update inflation measures" at the end of the calendar month and NOT when new data is released.
As I calculate it, CPI inflation appears in the chart below (along with the long-term average of 3.22% in blue).
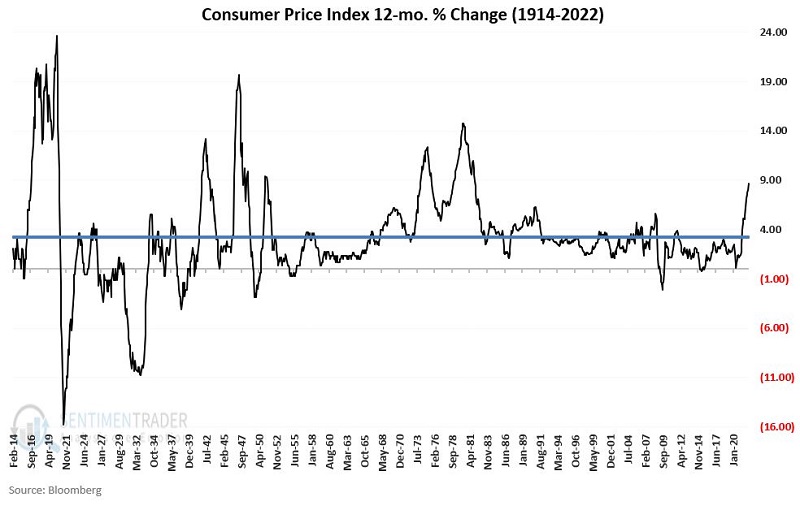
The calculation for CPI inflation:
A = The latest Consumer Price Index value itself (not the rate of change, but the actual latest reported index value)
B = The Consumer Price Index value from 12 months ago
C = ((A/B)-1) * 100
For example, on 4/12/2022 the latest CPI value was reported:
A= 287.708 (March 2022 index reading)
B = 264.793 (March 2021 index reading)
C = ((287.708/264.793)-1) * 100 = +8.654%
So, on 4/30/2022, I will record the month-end CPI inflation rate as +8.654%, up from +7.967% at the end of March.
The implications of high inflation
The chart below displays the growth of $1 invested in the Dow Jones Industrial Average only during those months when the previous month ended with a CPI Inflation rate of +8% or higher.
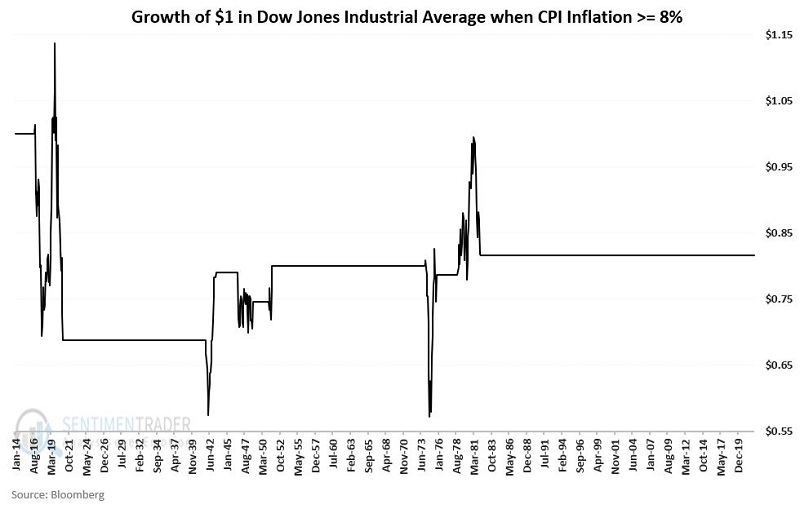
The key things to note are:
- CPI Inflation above 8% is not necessarily a "death sentence" for stocks
- However, performance has been net negative and extremely volatile
Clearly, high inflation is not a friend of the stock markets.
Rising versus falling inflation - and why it matters
According to the calculations shown above, as of May 1st, the two following factors will be true:
- CPI inflation rate >= 8%
- The current CPI inflation rate > the CPI inflation rate for the previous month
What might this mean for the stock market? The chart below displays the growth of $1 invested in the Dow Jones Industrial Average only during months when the two factors above were true (i.e., CPI inflation ended the previous >= 8% AND HIGHER than the month before that).
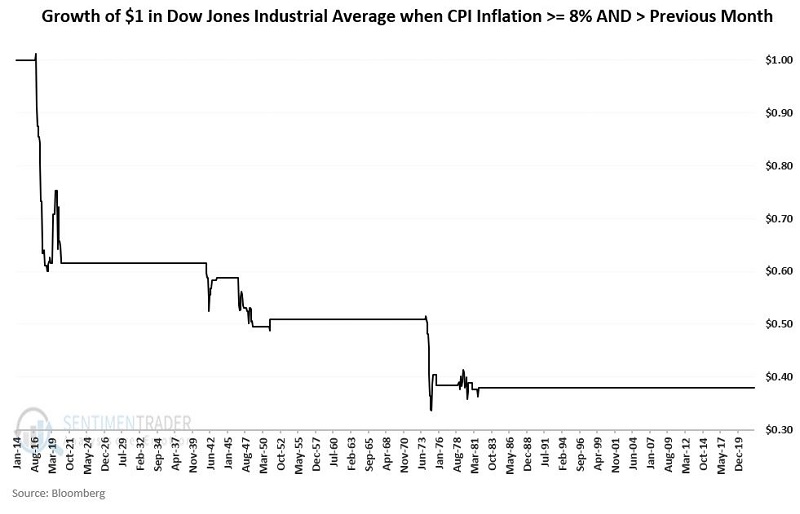
As you can see, when inflation is high (above 8%) and rising (higher than the previous month), stock market performance has been dreadful (net loss = -62%).
Now let's consider stock market performance when:
- CPI inflation is >= 8%
- The current CPI inflation rate < the CPI inflation rate for the previous month
The chart below displays the growth of $1 invested in the Dow Jones Industrial Average only during months when the two factors above were true (i.e., CPI inflation >= 8% AND LOWER than the month before that).
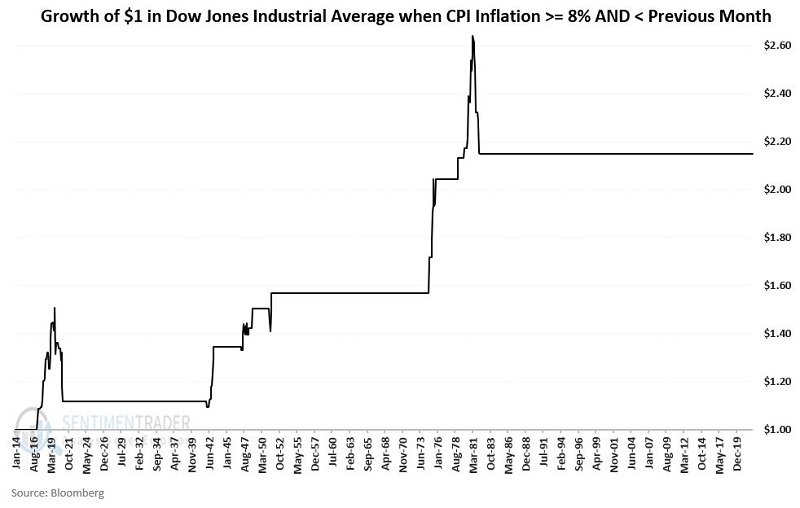
As you can see, when inflation is high (above 8%) but declining (lower than the previous month), stock market performance - while still extremely volatile - has been much better (+115%).
What's next?
I have no mechanism for accurately predicting how inflation will trend from month to month. The headlines regarding inflation are mostly gloom and doom. And given the historical market performance when inflation is high and rising, perhaps that is justified. But only to a point.
One old adage states that the stock market is a discounting mechanism. In other words, market performance is generally based on perceptions of what will happen in the future (hence another old adage that states, "Buy the rumor, sell the news."). While extremes in inflation (and/or deflation) are clearly negative for stocks, it is also true that once the market perceives that inflation has topped out, market performance can improve dramatically - even with the raw inflation number at a relatively high level.
What the research tells us…
For at least the month of May 2022, the method that I follow will rank inflation as a) high and b) rising - i.e., as an unfavorable factor for stocks. Historically, the stock market has been quite volatile, with a negative bias under this scenario. So, this factor must fall on the "bearish" side of the "weight of the evidence" ledger. However, once inflation shows signs of peaking, the outlook can shift dramatically. So, while we cannot predict what will happen next, we can keep a close eye on the inflation trend from here, knowing that "trending higher is bad" and "trending lower is good."
The bottom line is that investors may be able to "get a leg up" by simply taking a few moments each month to note the latest trend in CPI inflation. The next CPI reading will come out sometime in mid-May. If the 12-month % change at that time is below +8.654%, the outlook for the stock market may very quickly improve dramatically. If not, inflation will remain an unfavorable factor for stocks.