
When utility stocks and bond pessimism collide

Key points:
- Concerns about the impact of potentially higher interest rates on rate-sensitive securities are rising
- Optix readings for 5-year and 10-year treasuries are extremely low
- This configuration may be more favorable for utility stocks than most investors realize
10-year treasury Optix versus XLU
Many investors trade utility stocks as a proxy for the bond market because utility stocks typically offer a higher dividend yield than other stock market sectors. Interestingly, some noteworthy results for utility stocks have followed excesses in bond trader sentiment.
The top line in the chart below displays the Utilities Select Sector SPDR Fund ETF (XLU). The bottom line shows those times when the 10-day moving average for 10-year treasury note Optix has crossed below 8 for the first time in a month. You can run this test in the Backtest Engine.
The table below displays a summary of XLU performance following previous signals.
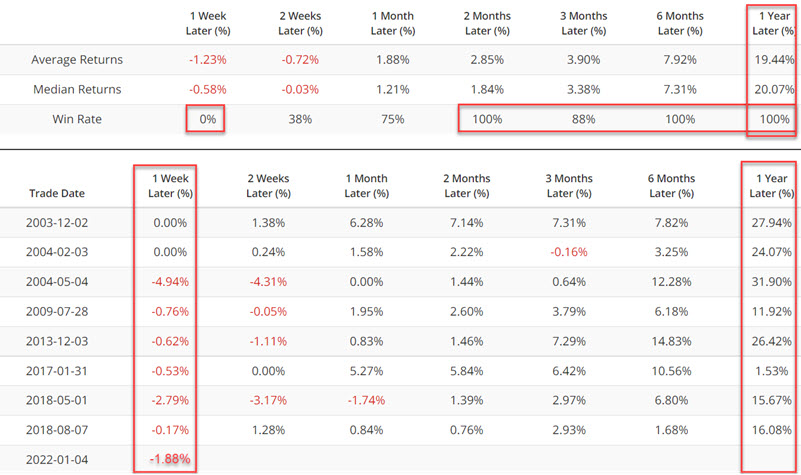
The results for XLU have had some interesting quirks:
- XLU has never shown a gain in the first week after a signal
- 2-month, 6-month, and 1-year returns have been positive after each signal
- The average and median returns for 1-year have been exceptionally robust
For example's sake, the average 1-year return for all days is +8.8%, the median 1-year return for all days is +11.3%, and the average Win Rate for all days is 78%.
In this context, the sharp decline for XLU in the week following the latest signal might be viewed as a buying opportunity.
5-year treasury Optix versus XLU
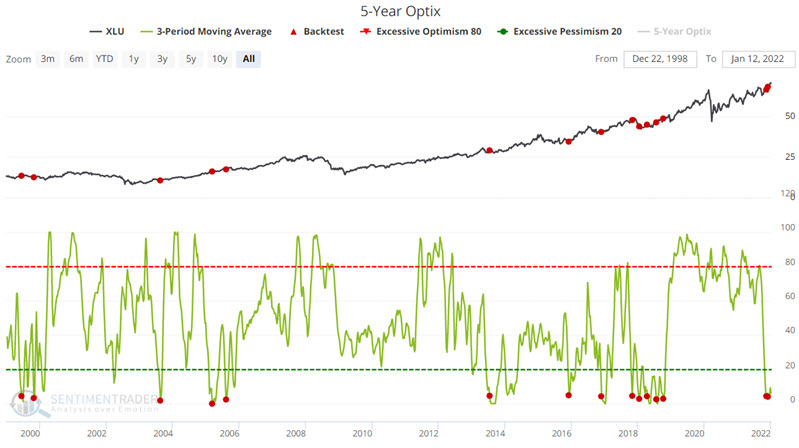
The top line in the chart below displays the Utilities Select Sector SPDR Fund ETF (XLU). The bottom line shows those times when the 3-day moving average for 5-year treasury note Optix has crossed below 5. You can run this test in the Backtest Engine.
The table below displays a summary of XLU performance following previous signals.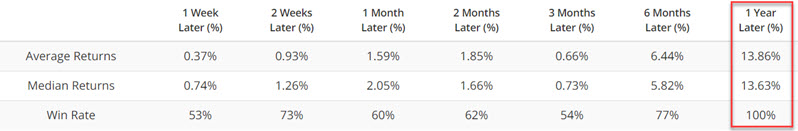
The results for XLU are not nearly as robust as with the earlier test. Still, 1-year returns have shown a positive result in every case.
The "Big Caveat" allayed
One of the concerns brewing these days is the potential for higher interest rates later this year, as many have adopted the mindset that the Fed will begin to tighten later this year and that higher interest rates will ensue. A potential kneejerk reaction then would likely be to point out that all of the results shown above occurred within the context of a long-term decline in interest rates and to invoke something along the lines of "it won't work as well when interest rates start rising."
There is a great deal of subjective conjecture in the paragraph above. However, much of it does seem to be gaining ground as common wisdom of late. We can't predict the future. We can, however, observe how utility stocks have performed in the past during a rising rate environment.
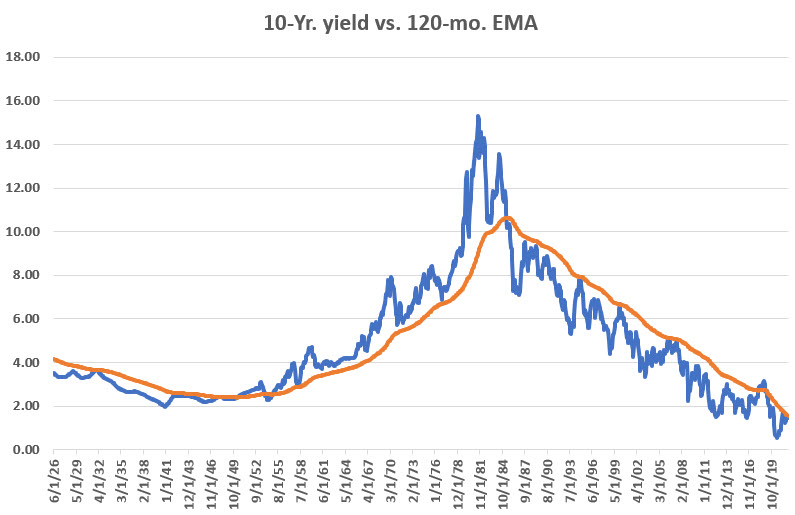
The chart below displays the month-end 10-year treasury yield versus its 120-month exponential moving average since 1926.
Now let's look at the performance of the utility sector only when the 10-year yield was above its 120-month EMA. The chart below displays the cumulative percentage +(-) for the utility sector if held only during those months when the previous month ended with the 10-year treasury yield above its 120-month exponential moving average since 1929.
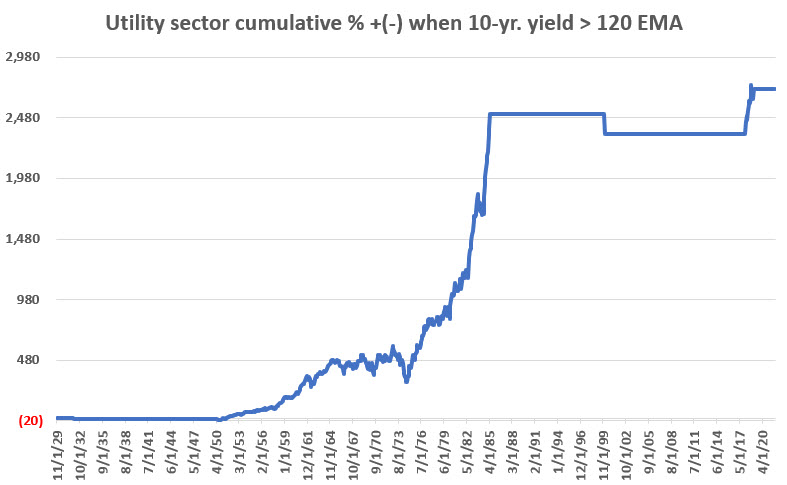
NOTE: We use the Fama French Index database from 1929 into 1990 and then the S&P 500 Utility Sector Index after that
The key takeaway:
- While utilities can decline when interest rates are in a longer-term uptrend
- However, the notion that rising interest rates doom utility stock performance appears to be incorrect
The bottom line: Fear of the Fed raising rates should not by itself keep an investor out of utility stocks.
What the research tells us…
Intense pessimism among bond investors has historically been followed by an above-average performance for utility stocks after a few early hiccups. In addition, history demonstrates that utility stocks can perform well even in a rising interest rate environment.