
When truck sales and the S&P 500 do this, pay attention

Key points:
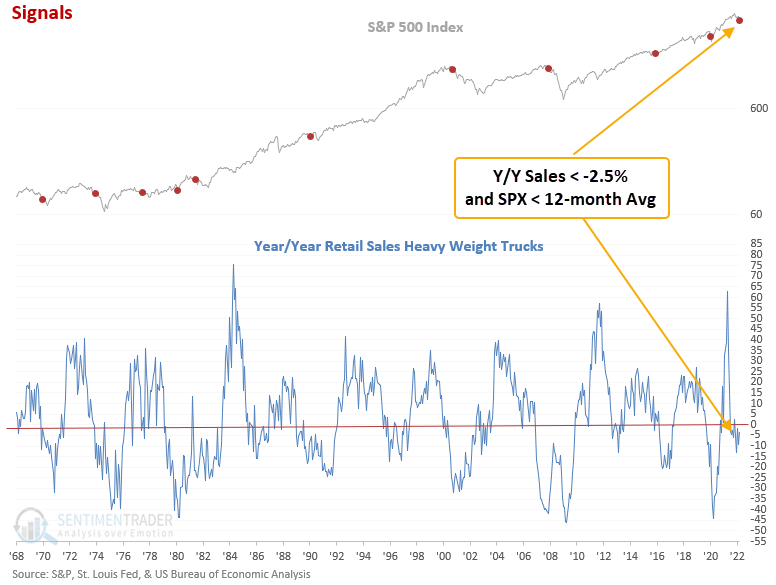
- The year/year change in heavyweight truck sales is negative
- At the same time, the S&P 500 closed below its 12-month moving average
- After similar signals, the S&P 500 shows negative returns on a short and medium-term basis
- Economic activity could hit a soft patch in the coming months
Heavyweight trucks sales as a leading indicator of economic activity
On Friday, the Burea of Economic Analysis released the April data for heavyweight truck sales. The series measures units sold for trucks with more than 14,000 pounds of gross vehicle weight. Heavyweight trucks move a large percentage of the dollar value of freight around the country. So, when a big-ticket expenditure that moves freight around the country contracts on a y/y basis, we should take note as it can foreshadow a slowdown in overall economic growth.
A new signal from a voting member in the TCTM Recession Composite Model registered an alert with the April update.
The model identifies the following:
- The year/year change in heavyweight truck sales is -2.5% or worse
- The S&P 500 closes below its 12-month moving average
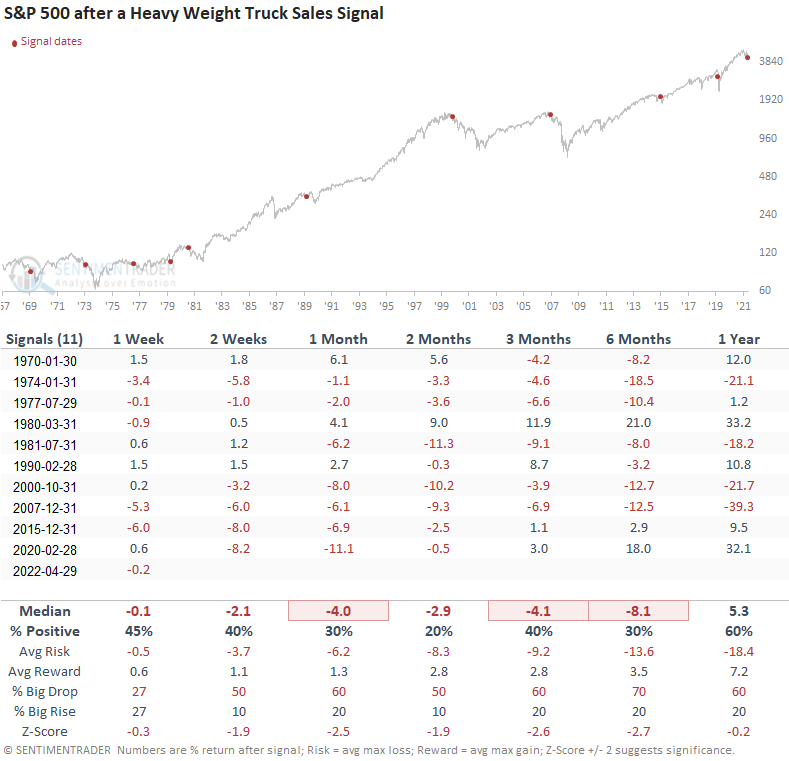
Similar contractions in heavyweight trucks sales suggest negative returns
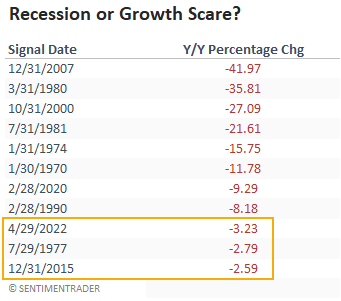
This indicator generated a signal 11 other times over the past 52 years. After the others, S&P 500 future returns, win rates, and risk/reward profiles were unfavorable across short and medium-term time frames. Returns were negative at some point in the first 6 months in 11 out of 11 instances. The 1977 and 2015 signals are the only instances that didn't lead to or coincide with a recession.
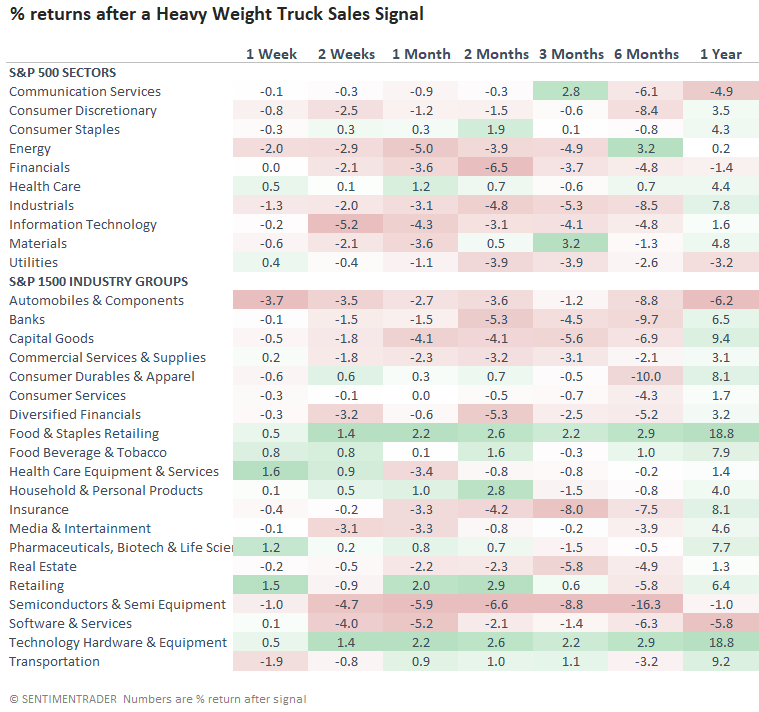
Sector and industry group performance after signals
The sector and industry group return table confirms the cautionary outlook for stocks. Defensive sectors and industries performed much better, while cyclical groups were underwhelming, especially financials.
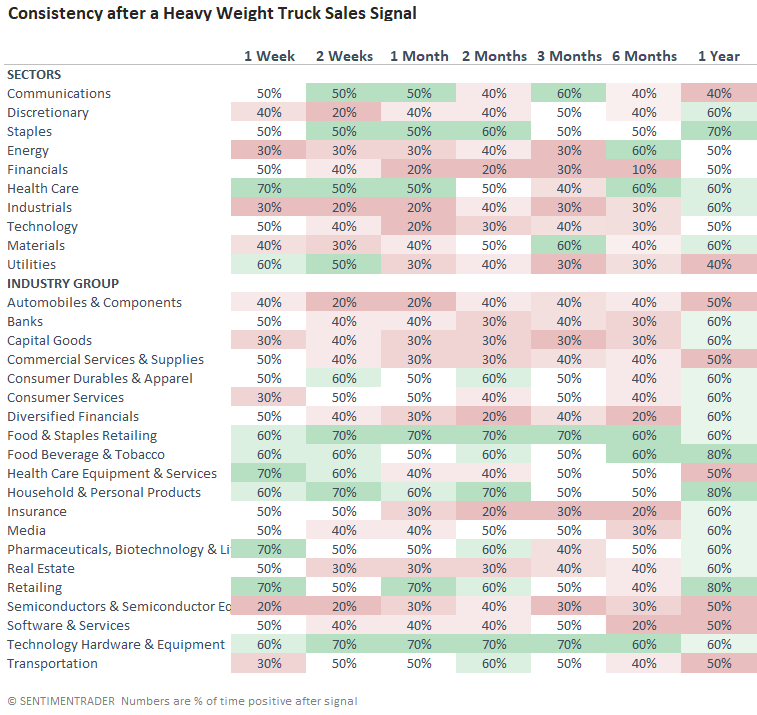
Consistency looks unfavorable
Consistency shows the same pattern as the return table. Defensive groups show a better win rate than cyclical groups. Once again, financials look abysmal, with a win rate of 10% six months later.
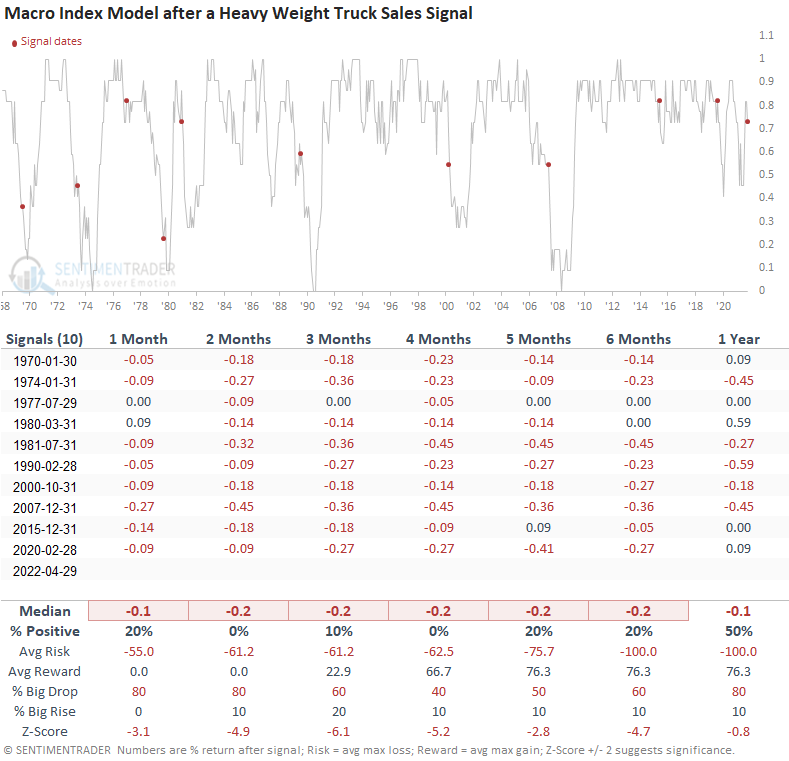
What happens to the Macro Index Model after signals
Applying the signal dates to the SentimenTrader Macro Index Model suggests the index will likely fall below the favorable 70% level in the coming months.
With truck sales down 3.23% on a year-over-year basis, one could make the case that the current signal turns out to be more like the 1977 or 2015 growth scare corrections. The TCTM recession composite signal count stands at 10%. So, the weight of the evidence suggests a recession is unlikely for now
What the research tells us...
When heavyweight truck sales contract and the S&P 500 closes below its 12-month moving average, a leading economic indicator and the stock market are flashing a warning sign. Similar setups to what we're seeing now have preceded weak returns for the S&P 500 across short and medium-term time frames. A review of sectors and industries suggests we should continue with a defensive portfolio tilt over a cyclical one. Finally, we should be mindful that the economy could slow in the coming months. Whether it's a growth scare or a recession remains to be seen. I would keep an eye on the Macro Index Model.