
When the Stock Market Meets Year 6

Key points:
- As we enter 2026, let's take a moment to reflect on the historical performance of stocks during previous Years ending in "6"
- One interesting pattern has emerged in the last century during Year 6 of the decade
- Generally speaking, we should look for stock market strength during the first and fourth quarters, and potential trouble in between
A Look at S&P 500 action in Decade Year "6"
For our test, we will use S&P 500 monthly closing price data from 1920 to the present. We will look specifically at years ending in "6" - i.e., 1926, 1936, 1946, etc.
From our analysis, a certain general pattern emerged, which can be summed up as follows:
- First three months = Good
- Next six months = So/So
- Last three months = Good
Of course, this is a generalization, and may or may not have any bearing on 2026, 2036, and so on. However, for the sake of setting expectations for the year ahead, it is worth knowing about.
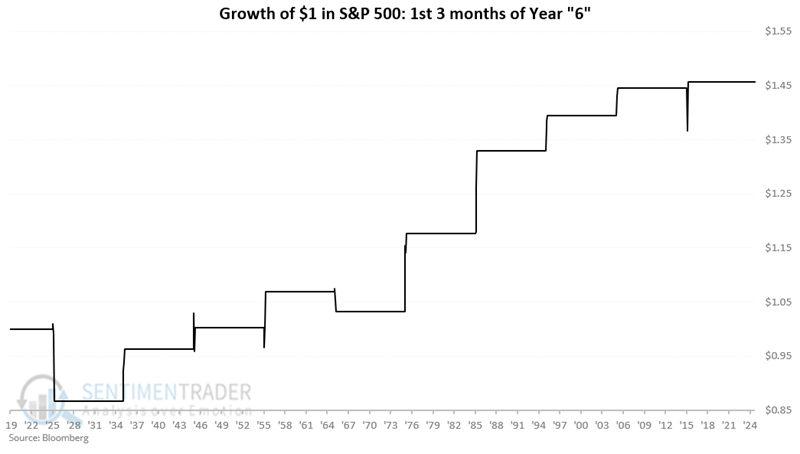
The first three months of Year 6
The chart below displays the hypothetical growth of $1 invested in the S&P 500 only during January, February, and March of years ending in "6."
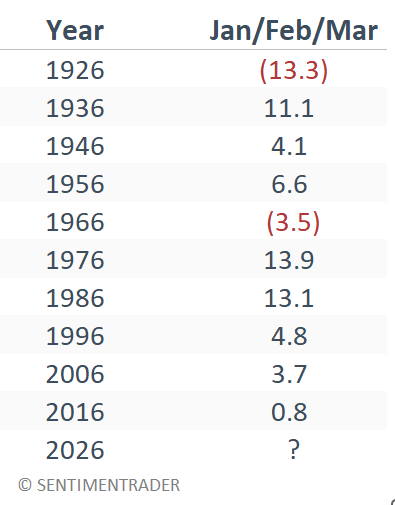
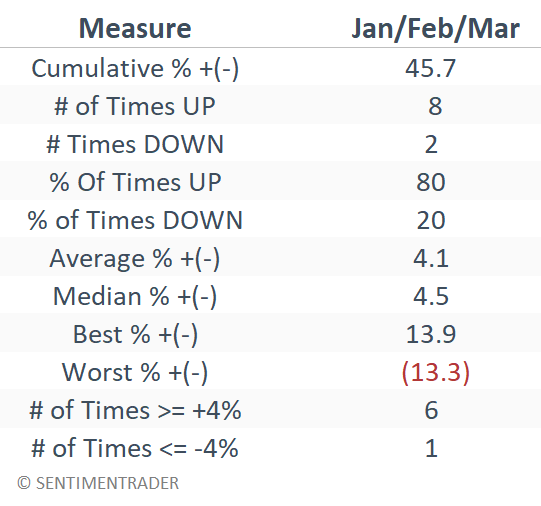
The tables below show decade-by-decade results and a summary of performance during the first three months of Year 6.
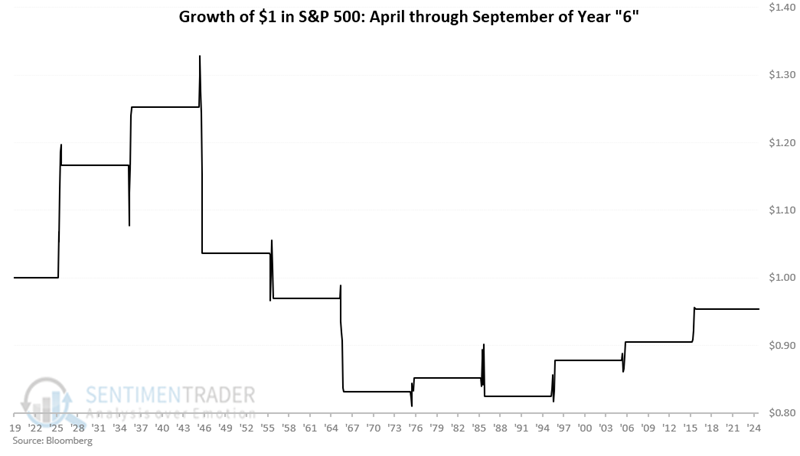
The middle six months of Year 6
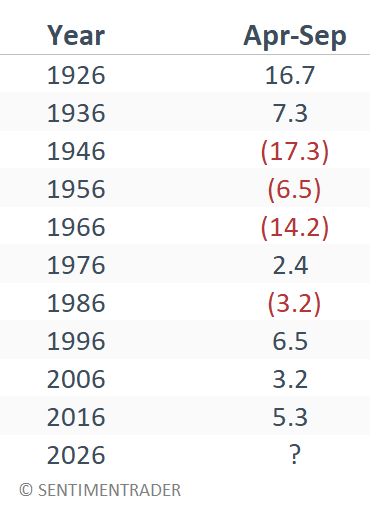
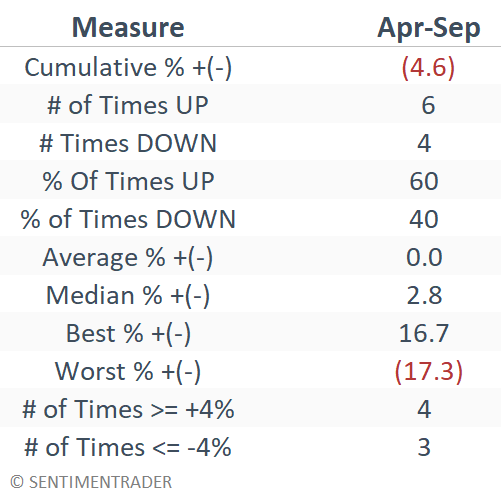
The chart below displays the hypothetical growth of $1 invested in the S&P 500 only during April through September of years ending in "6."
The tables below display decade-by-decade results and a summary of performance from April to September of Year 6.
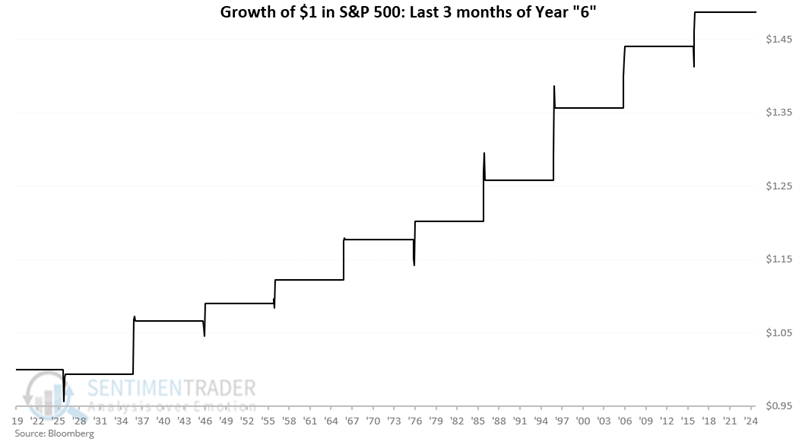
The last three months of Year 6
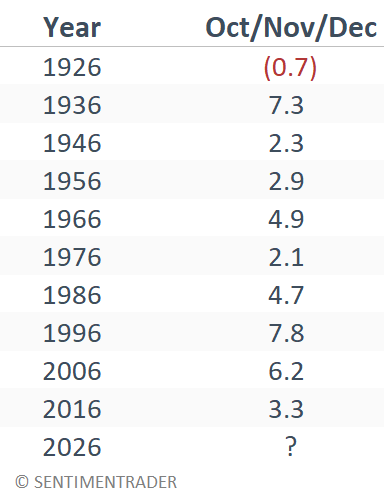
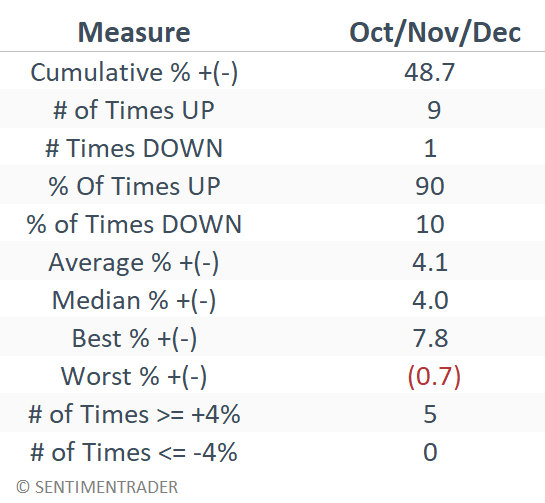
The chart below displays the hypothetical growth of $1 invested in the S&P 500 only during October, November, and December of years ending in "6."
The tables below show decade-by-decade results and a summary of performance during October, November, and December of Year 6.
Combining the first and last three months of Year 6
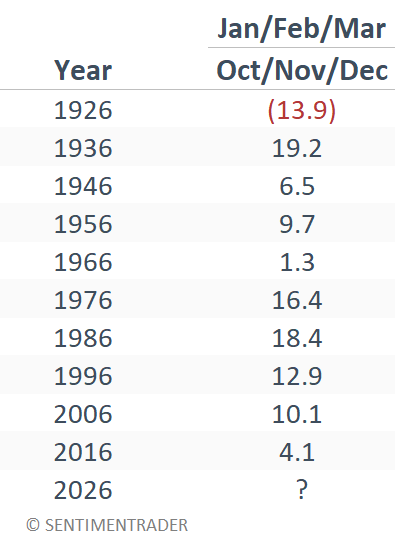
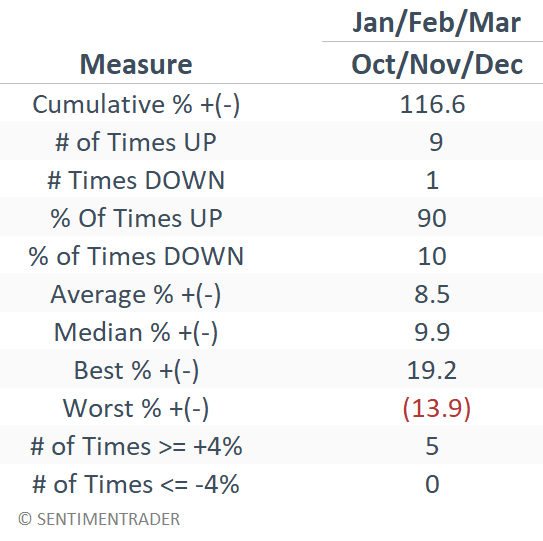
Now, let's examine the S&P 500 performance if we hold the index for the first three months and the last three months of Year 6. The chart below displays the hypothetical growth of $1 invested in the S&P 500 only during January, February, March, and October, November, and December of years ending in "6."
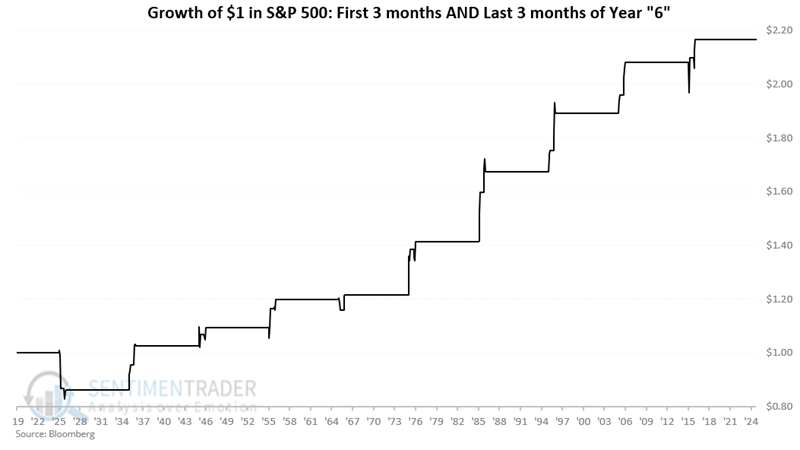
The tables below show decade-by-decade results and a summary of performance during the first and last three months of Year 6.
What the research tells us…
Do the results above suggest that stock market investors should head for the hills on March 31, 2026, and not return until October 1, 2026? Not necessarily. The history detailed above is more about helping investors set proper expectations for the year ahead.
The tendency for strength during the first quarter of Year 6 aligns well with the current uptrend in the status of the major market indexes. However, any sign of price weakness during the middle six months should not be ignored or written off, particularly as mid-term election years are known for market corrections.
Conversely, mid-term election years are also known for pullbacks that often set the stage for launching market advances during the fourth quarter. This tendency aligns perfectly with the tendency for the stock market to show strength during the fourth quarter of Year 6.