
When technological momentum coincides with weakening crude oil prices

Key Points:
- Technology and energy momentum diverge, crude oil remains at low levels, market shows divergence
- Cyclical sectors face pressure, defensive stocks demonstrate resilience
- Short-term risks persist
Divergent Market Narratives
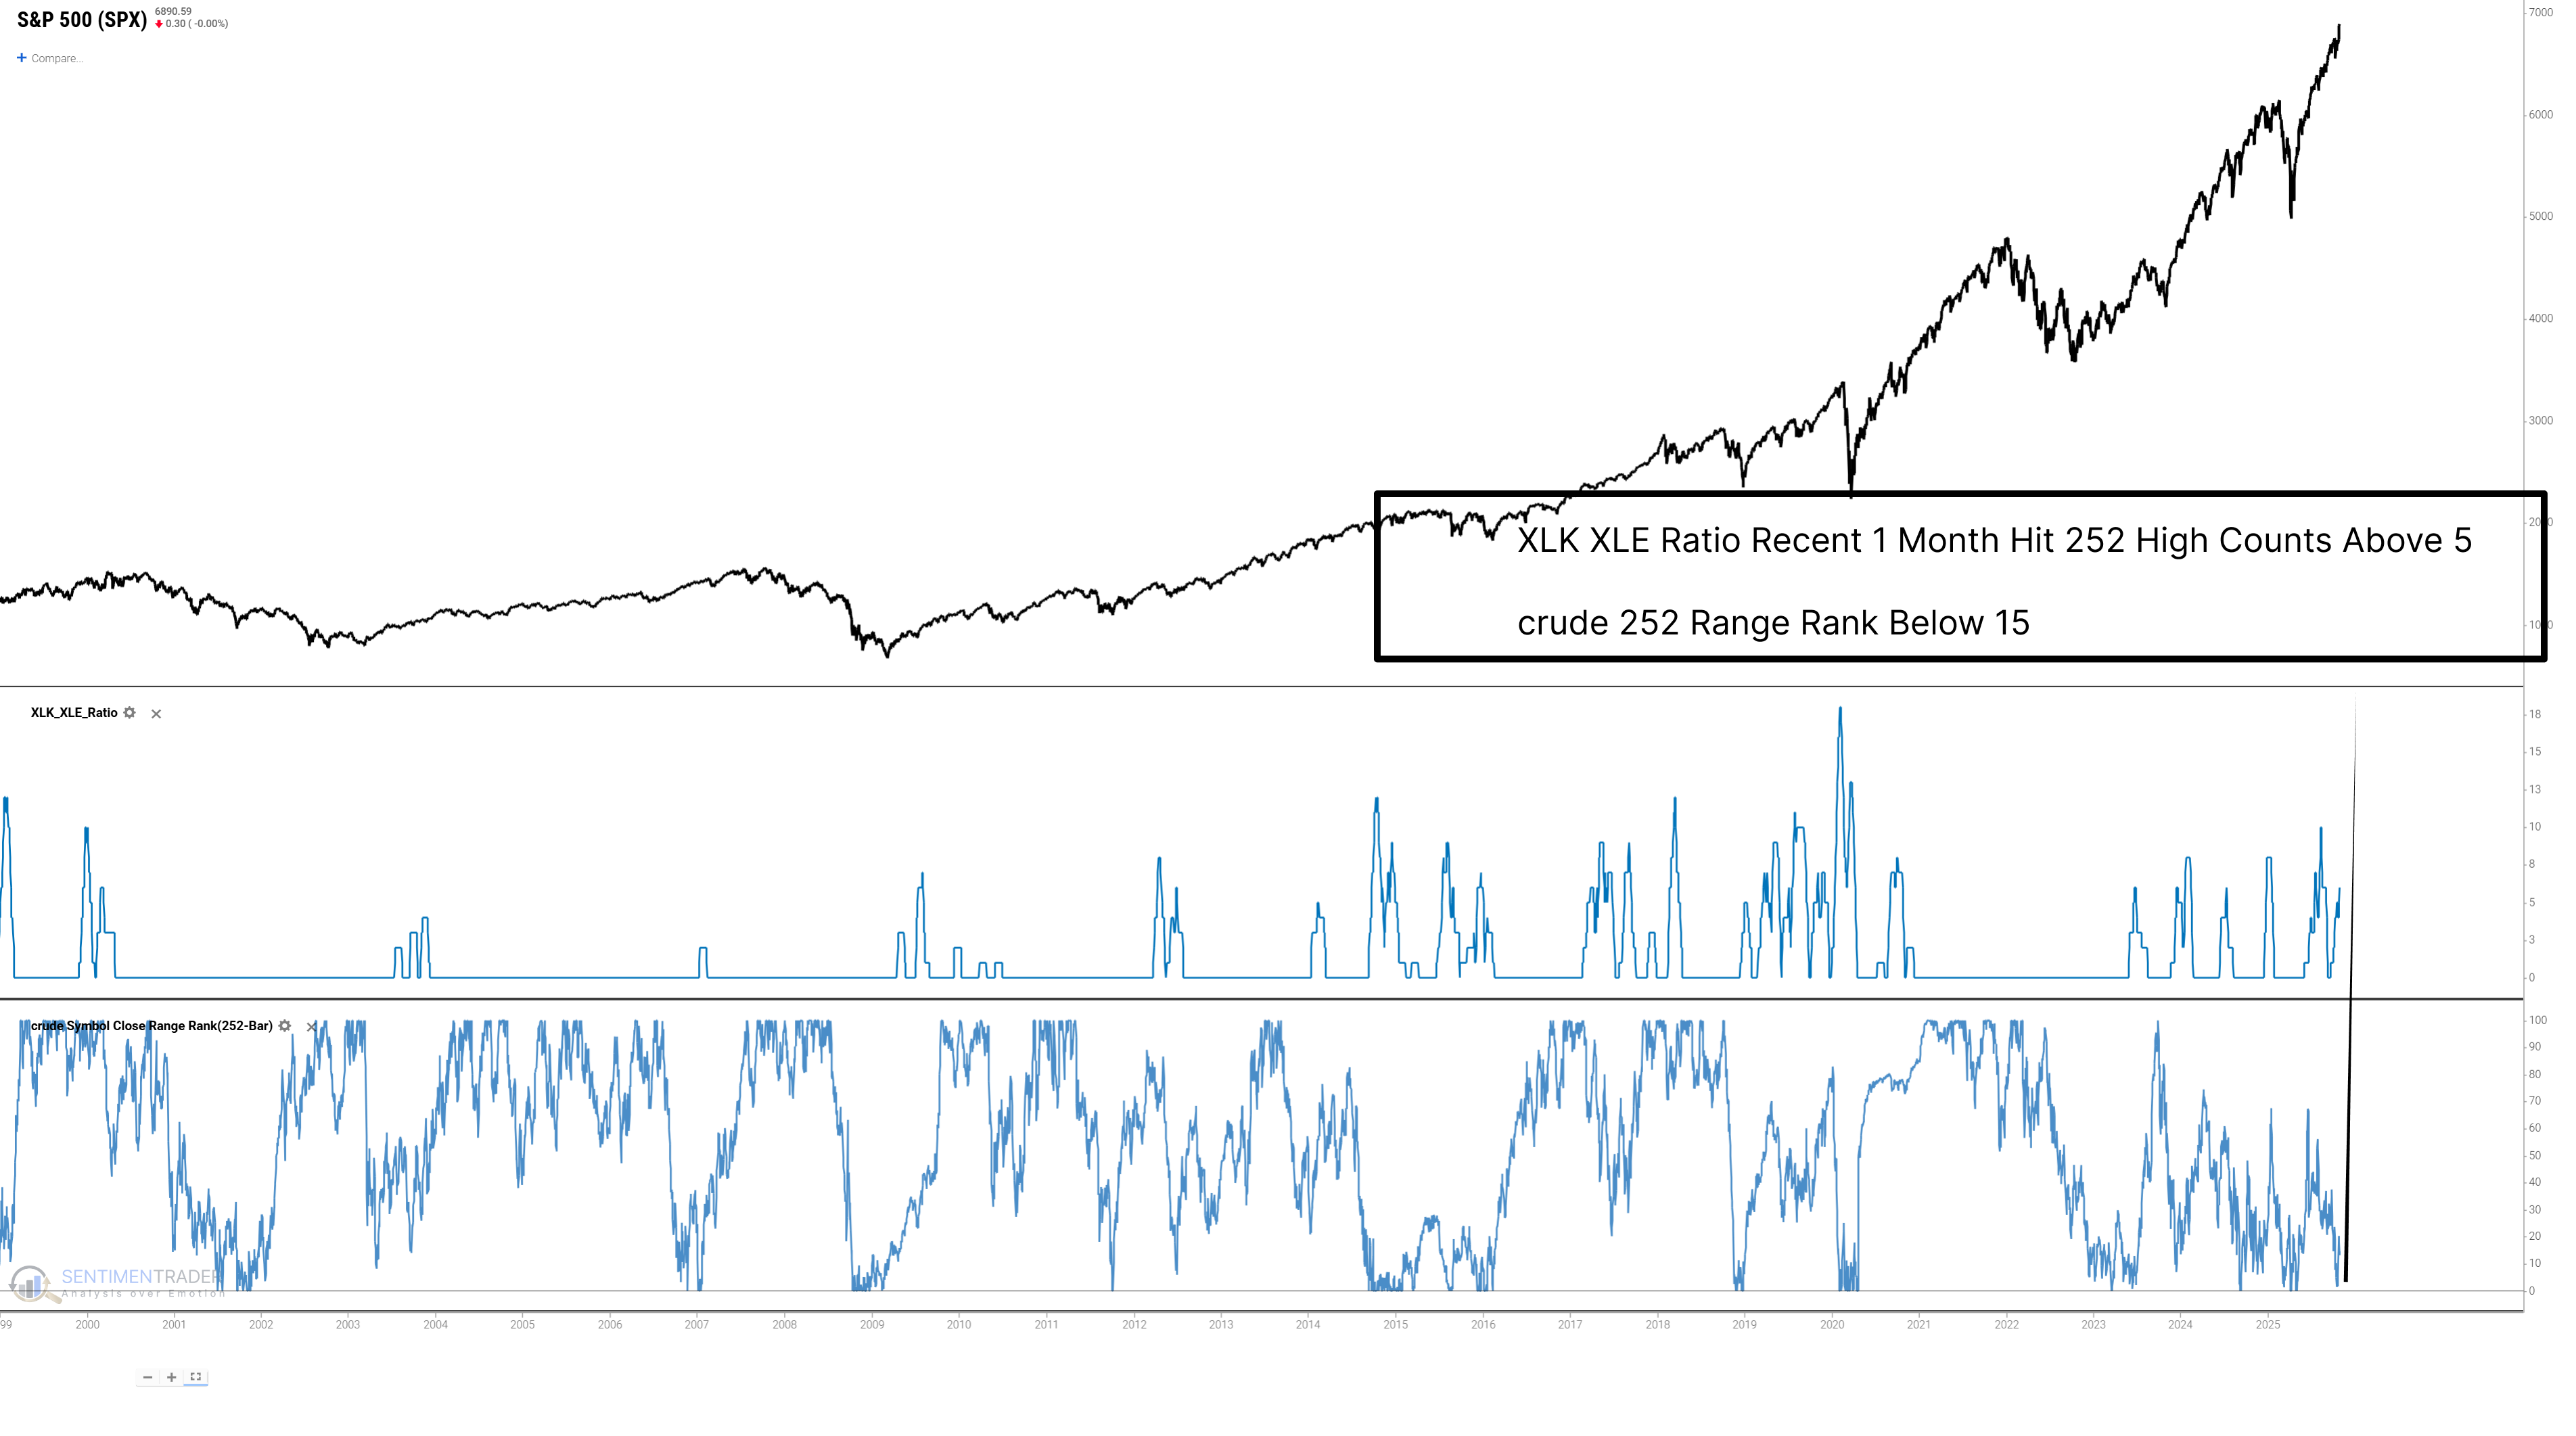
Recent market observations reveal a pronounced divergence. On one hand, the Technology/Energy (XLK/XLE) ratio has repeatedly hit annual highs (>5 times) over the past month. This signal is typically interpreted as market preference for the "new economy" and robust growth expectations.
On the other hand, a key economic cycle input-crude oil prices-is currently at the lowest 15th percentile of its annual range. Historically, this has often correlated with slowing demand or deflationary pressures.
These two narratives appear contradictory. Is the market pricing in a "soft landing" for tech while simultaneously pricing in a "hard landing" for energy? To explore the potential implications of this rare combination, we examine its historical performance.
A statistically unreliable and short-term cautious signal
Before conducting any analysis, we must first acknowledge a core limitation: this signal combination (a strong XLK/XLE ratio coupled with extremely weak crude oil) is historically extremely rare, having triggered only about 8 times. This sample size is too small to draw any robust statistical conclusions.
With this caveat acknowledged, examining these limited cases reveals unfavorable short-term performance for the S&P 500.Related Backtest Click Here.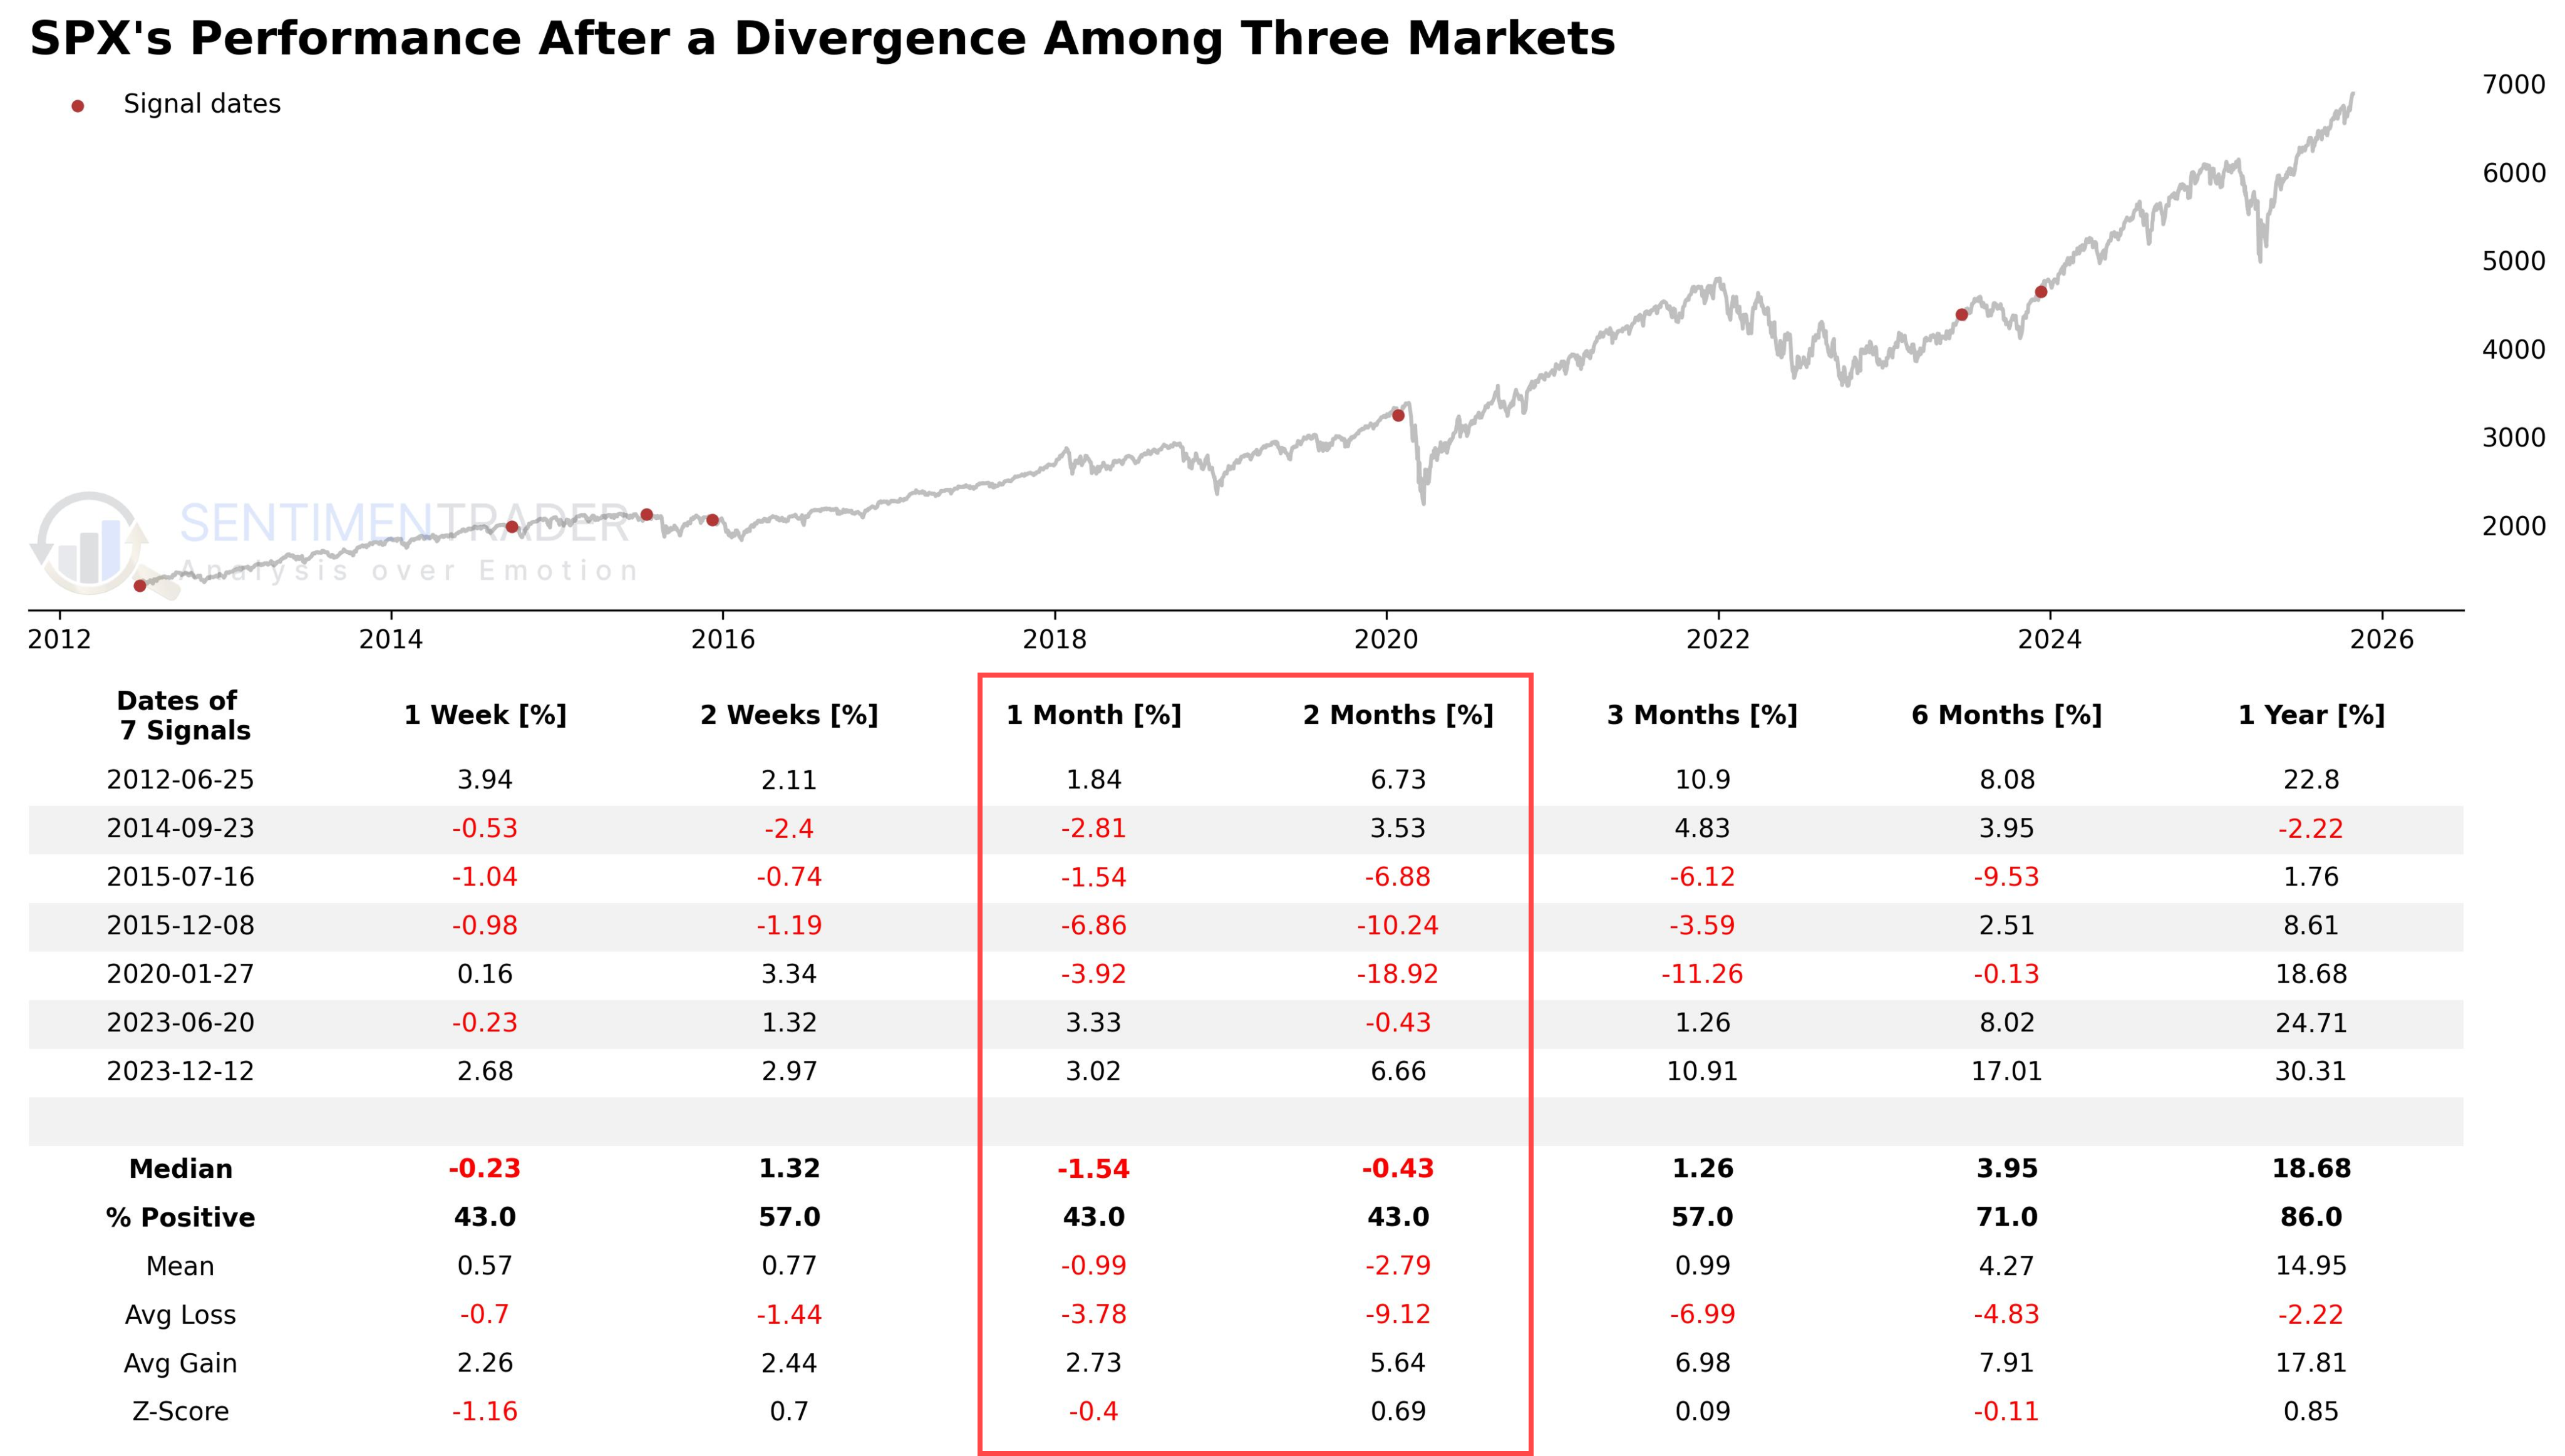
Whenever this signal appeared, the S&P 500 delivered a median return of -1.5% over the next month and -0.4% over two months. Within the 1-2 month timeframe, the index's win rate (% Positive) was a mere 43%, below the probability of flipping a coin. This suggests that rather than signaling a "Goldilocks" scenario in the near term, this indicator may instead point to market stress or uncertainty.
Short-Term Capital Flows Point to Defensives
Although short-term rebounds in crude oil prices are always possible, historical precedents indicate that this signal does not mark the bottom for the commodity.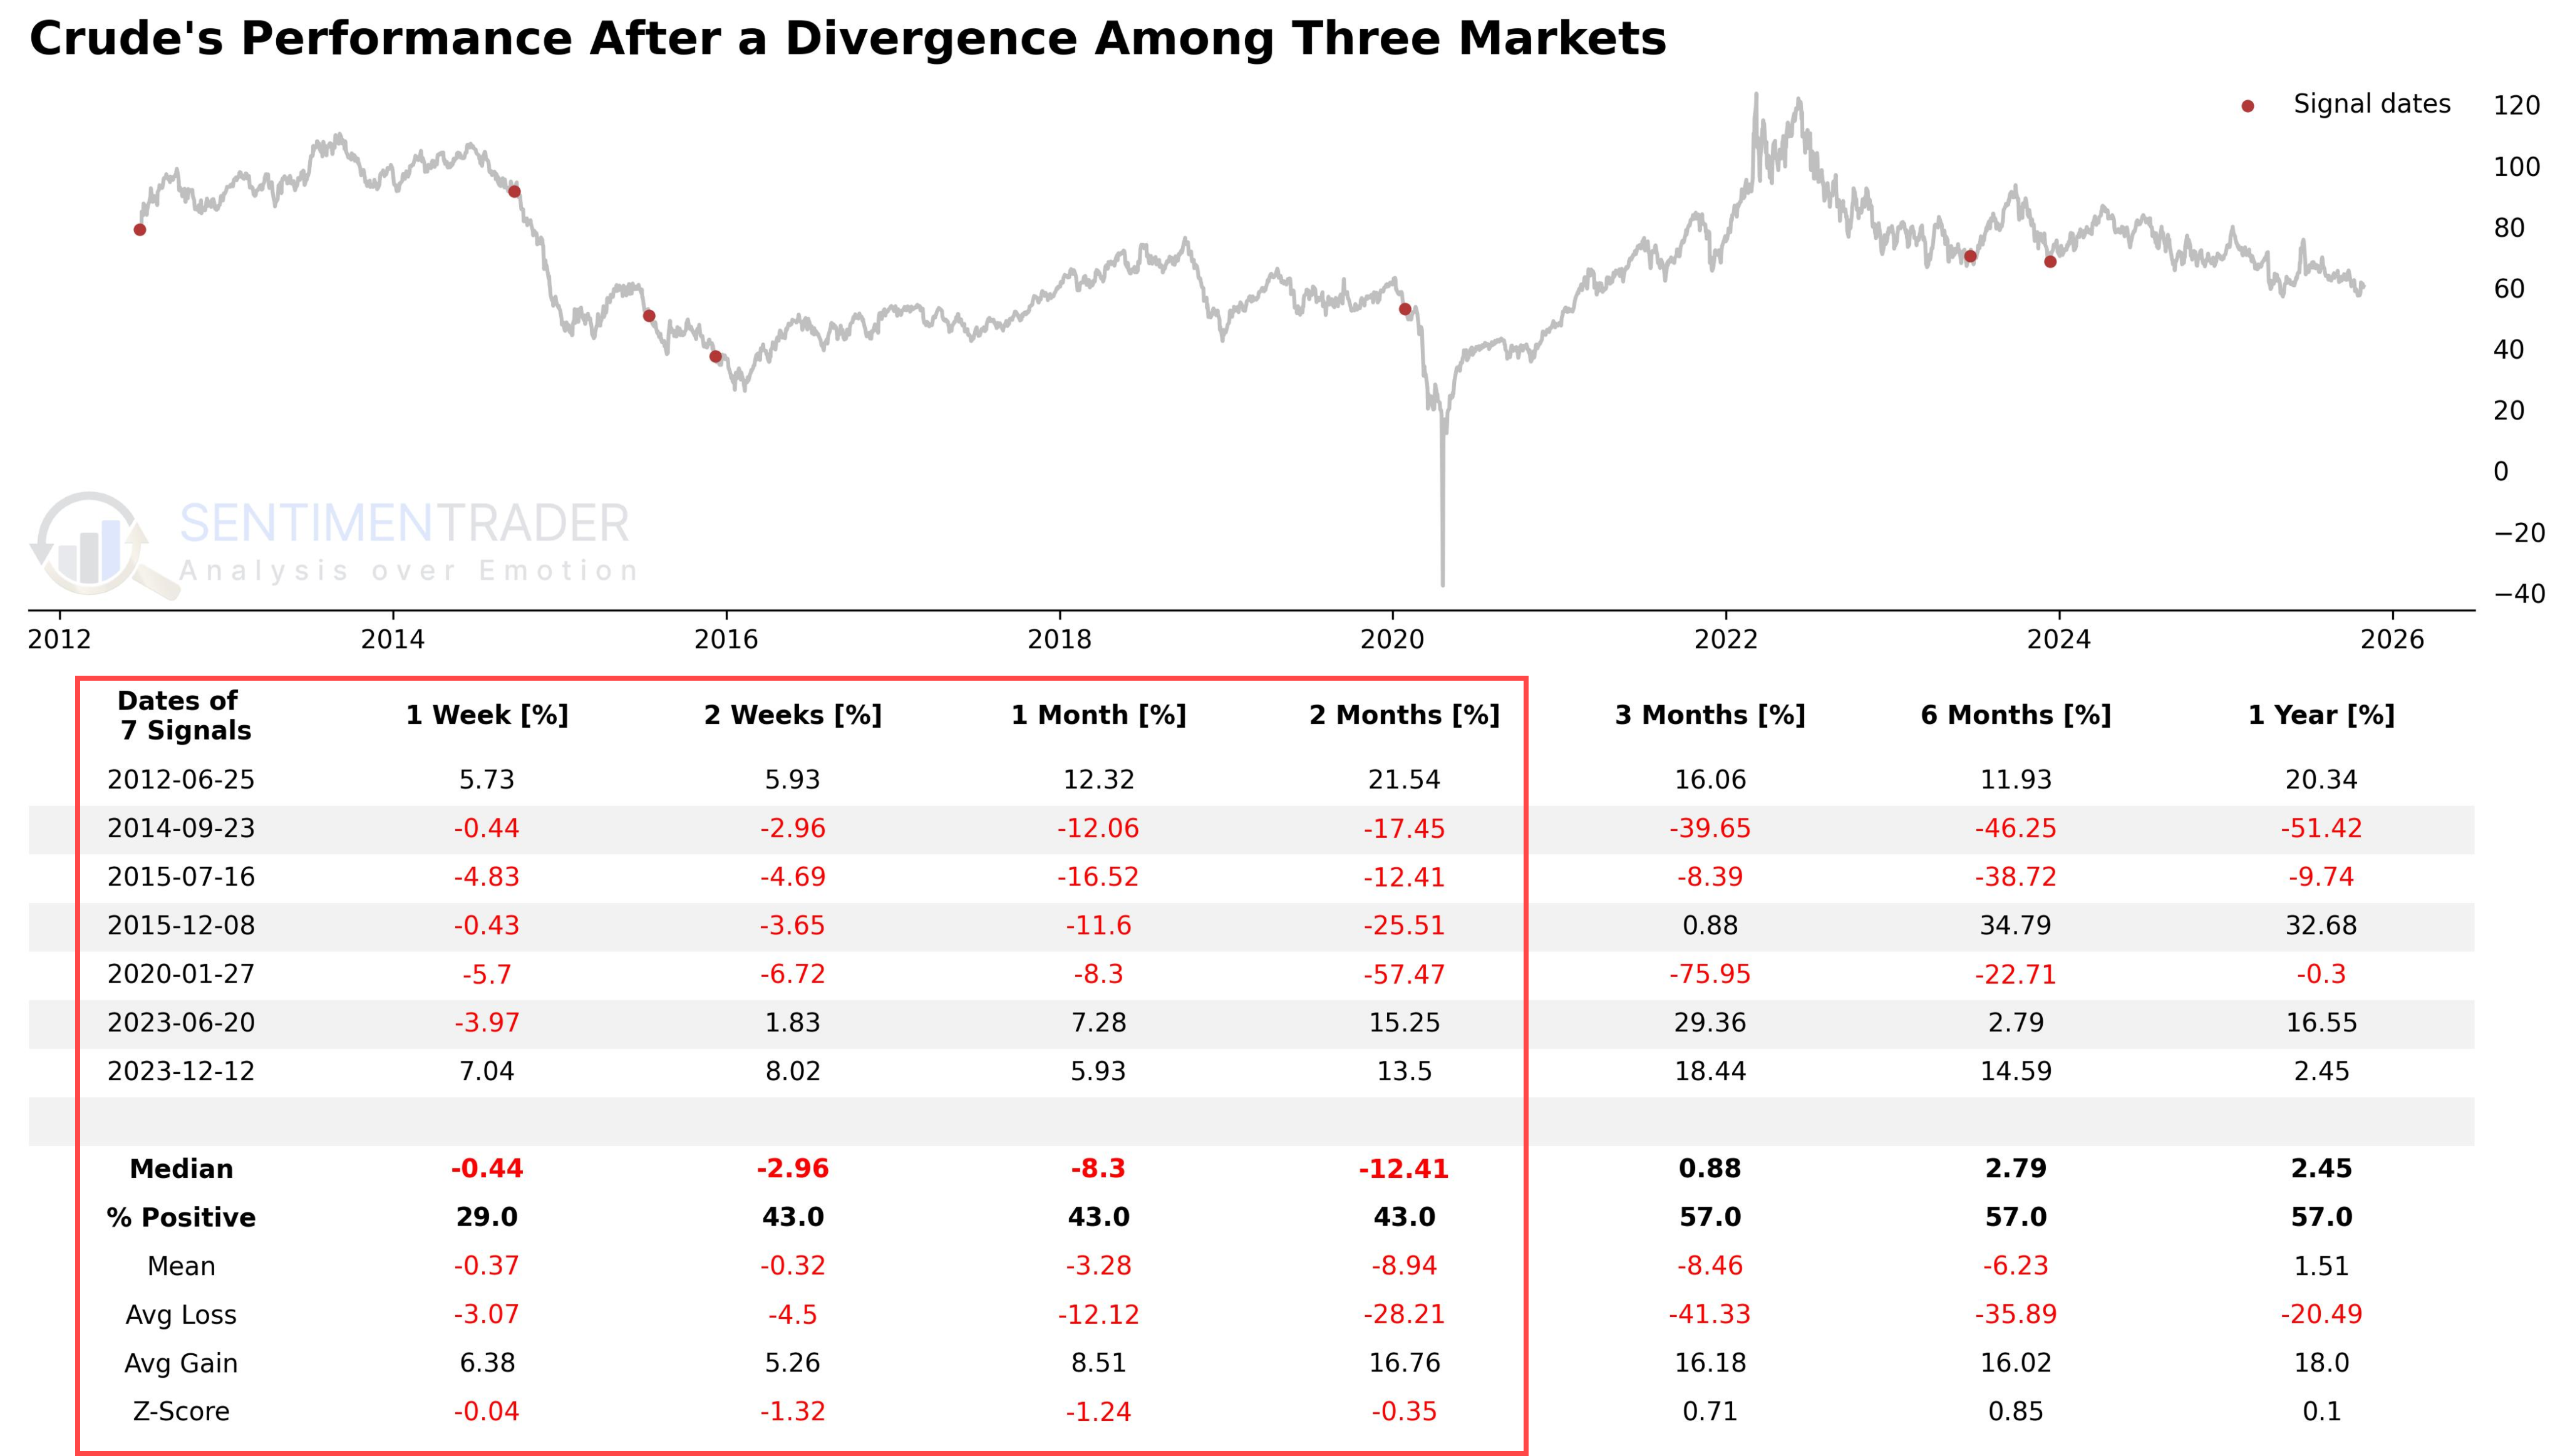
Instead, this weak momentum often persists or even accelerates the downtrend. In the first month following the signal trigger, Crude Oil itself recorded a median return of -8.3%, with a win rate of just 43%. This weakness tends to extend into the second month, where the median return stands at -12.41%.
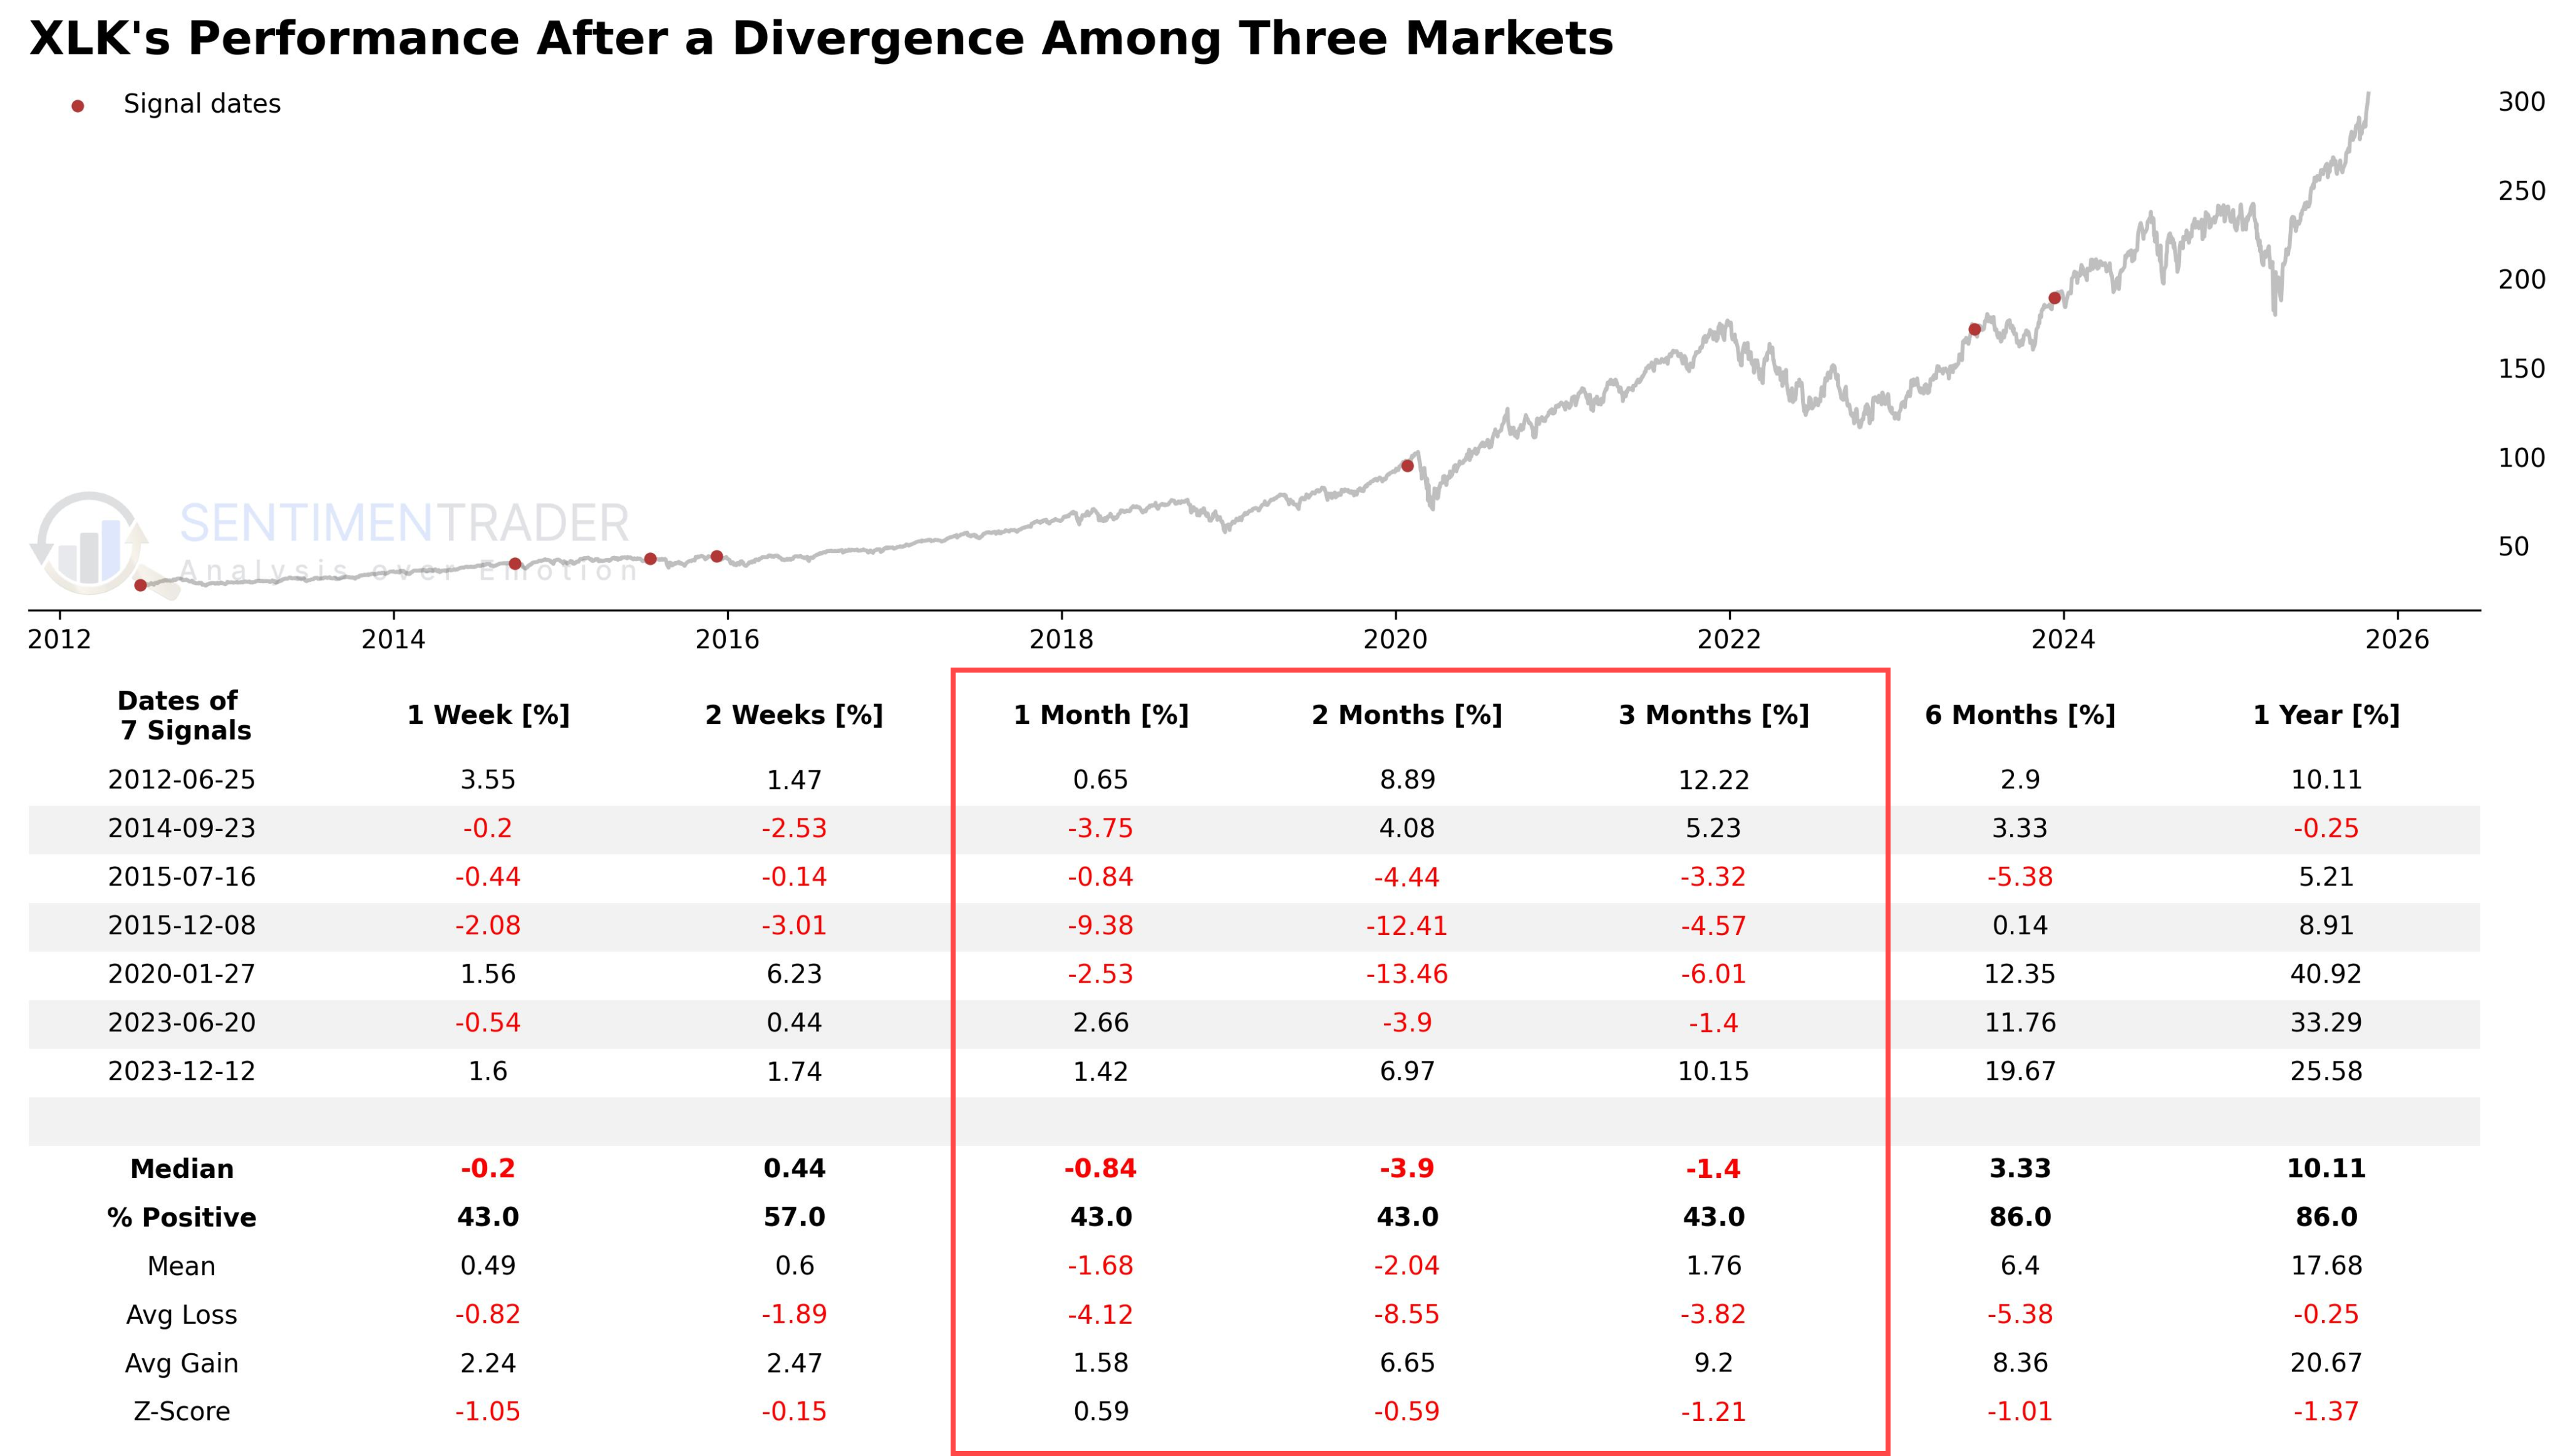
Notably, even technology stocks (XLK)-the "stronger" side in the signal-did not escape short-term underperformance. XLK recorded negative median returns over the 1- to 3-month horizon. This strongly suggests the signal is a "relative strength" signal (i.e., XLK declines less than XLE) rather than an absolute bullish momentum signal.
Short-Term Resilience of Defensive Sectors
So, where did capital flow in these limited cases?
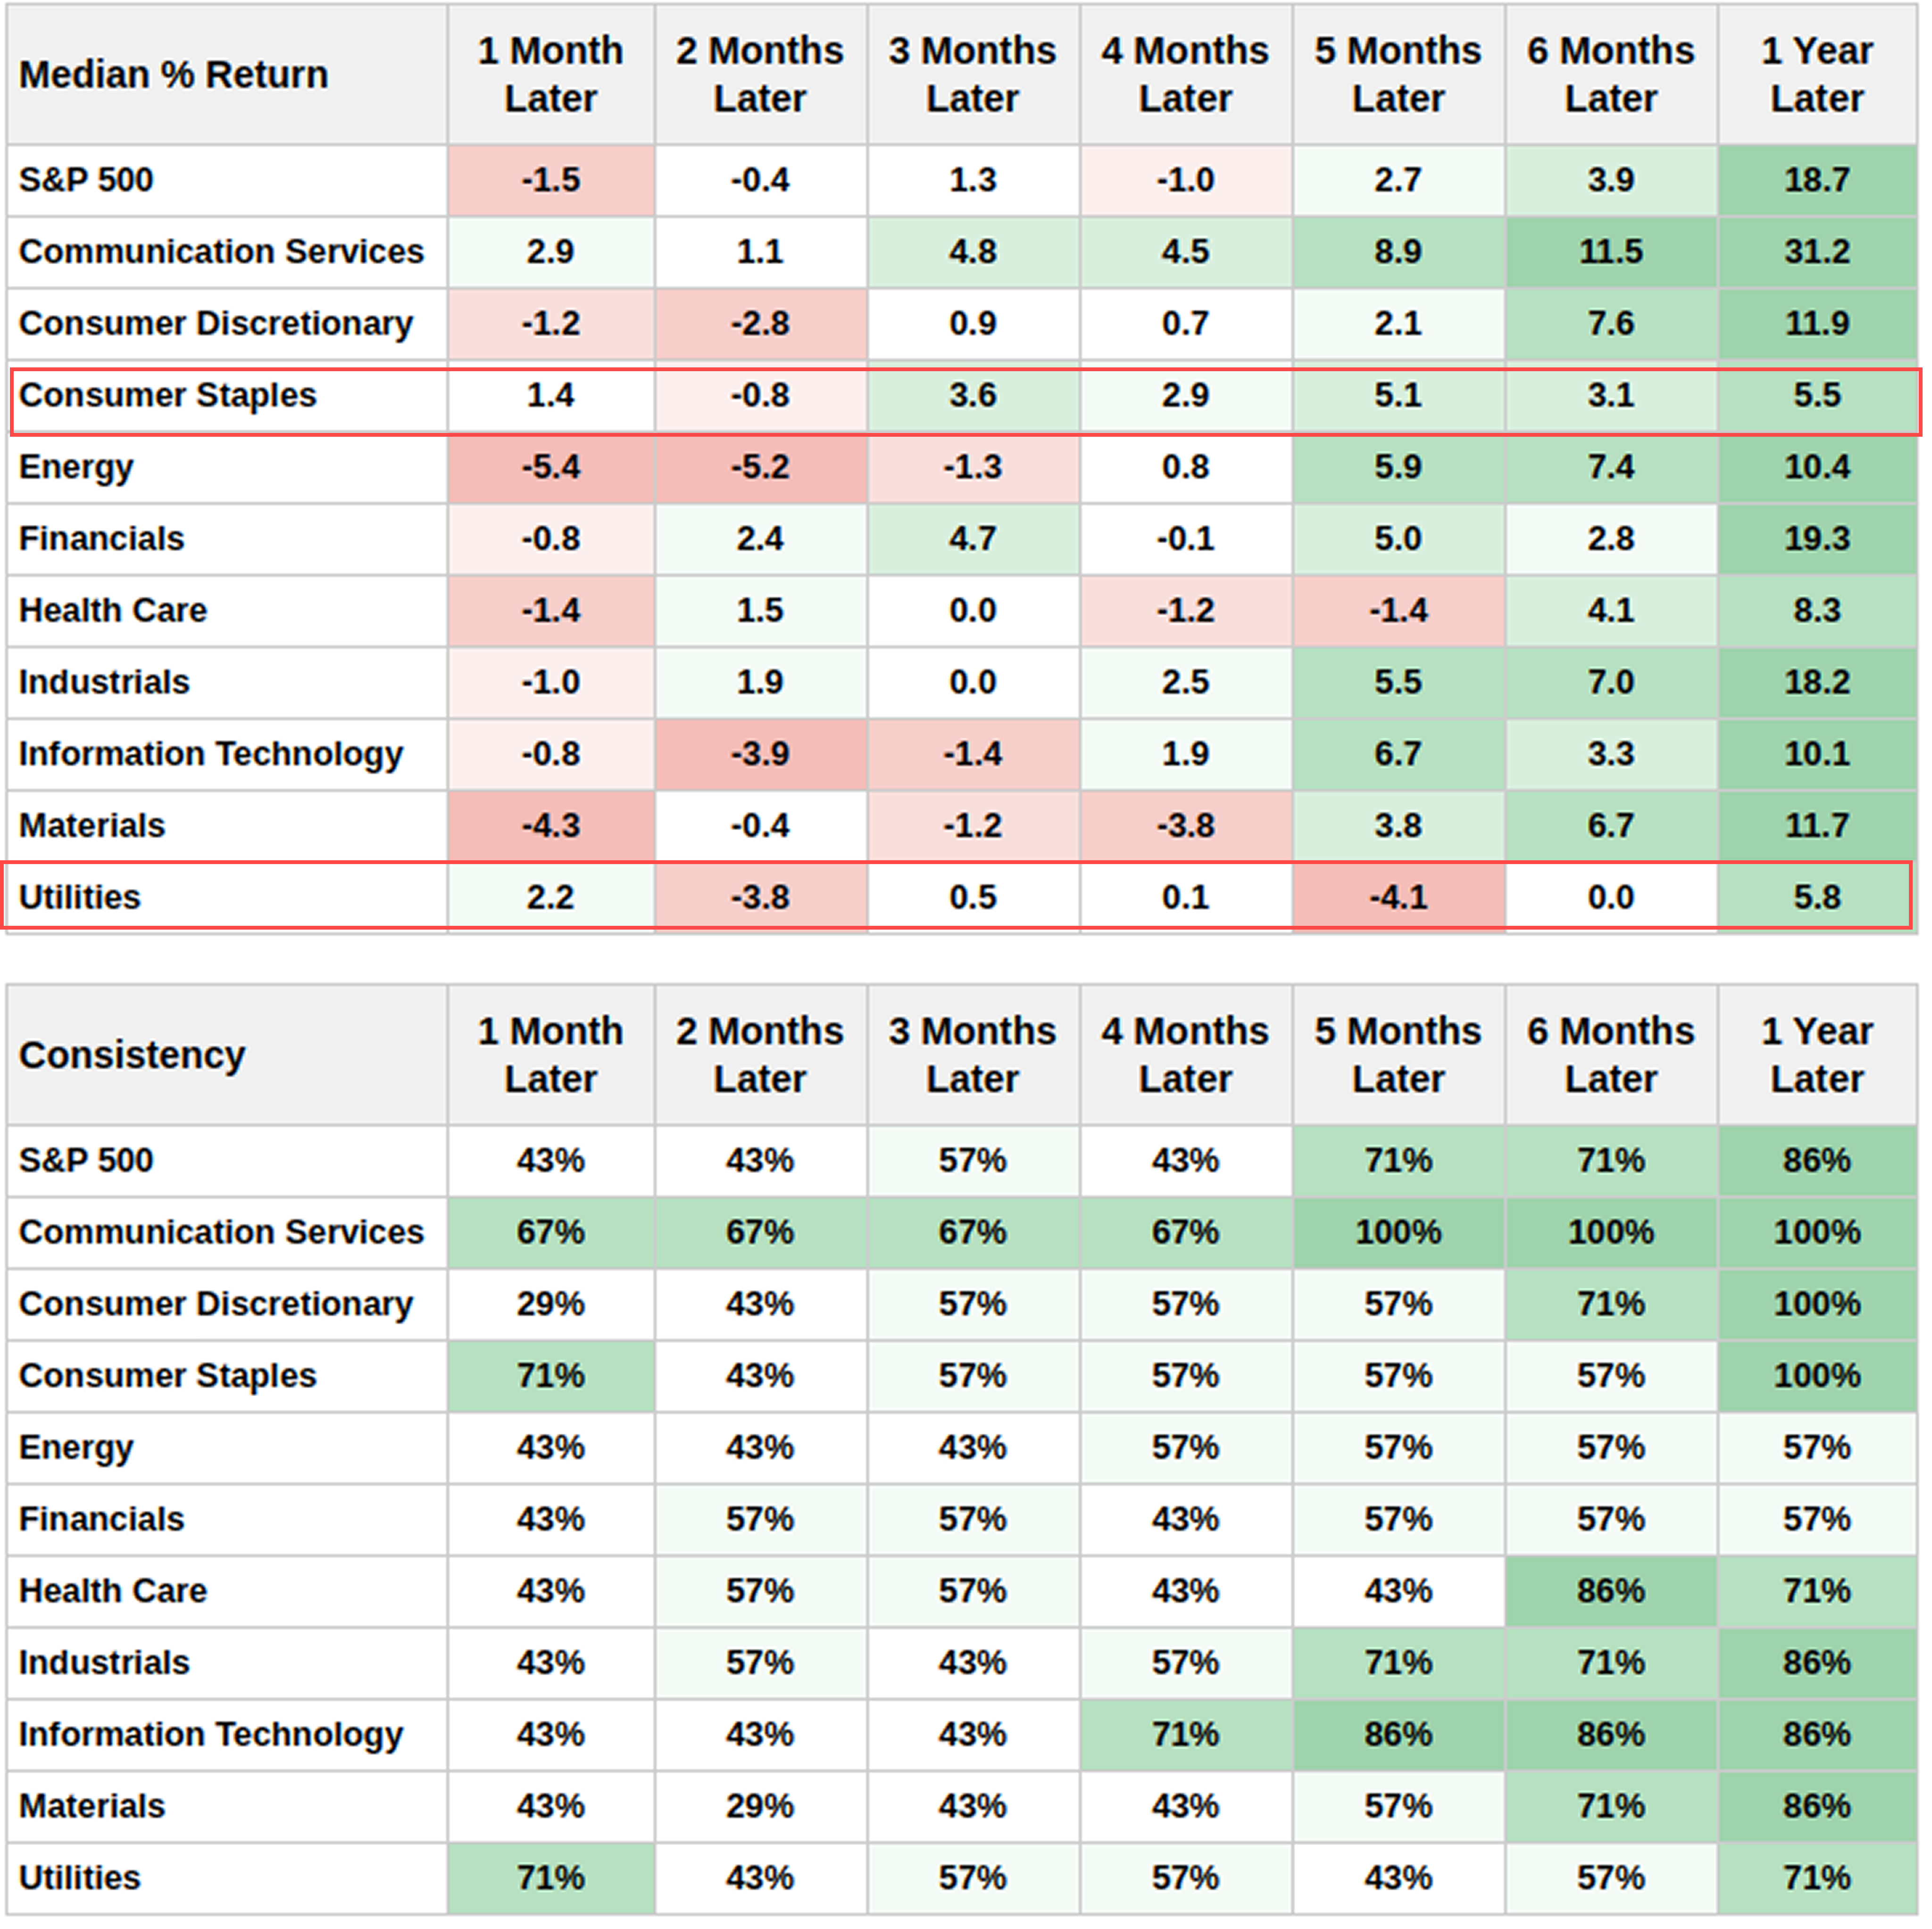
Data shows that classic defensive sectors demonstrated the strongest short-term resilience. Utilities (XLU) (+2.2%) and Consumer Staples (XLP) (+1.4%) were among the sectors with the highest median returns after one month, both boasting a 71% win rate.
An interesting exception is Communication Services (XLC) (+2.9%), which also delivered positive returns and resilience in the short term. This may indicate that the market views it as a "new economy" asset with defensive properties during these specific periods of stress.
What the research tells us...
When robust tech/energy momentum coincides with collapsing crude oil prices, we should not interpret this as an "economic positive" (unlike some other divergence signals). Instead, our extremely limited data may suggest it is a signal of short-term economic distress or deflationary concerns. In this context, weak crude oil is not a "stimulus" but rather a symptom that weighs on the market in the short term.
Following these (rare) precedents, the S&P 500 struggled in the short term (1-3 months). Unsurprisingly, cyclical sectors (XLE, XLB) underperformed, while defensive sectors (XLU, XLP) and XLC provided temporary relative safety.
From a broader perspective, this particular decline in crude oil prices should be viewed with caution, rather than as a bullish catalyst for equities. Although 12-month returns ultimately turned positive in this small sample (likely skewed by extreme values such as the 2020 V-shaped recovery), the immediate, short-term path appears to point to volatility and a rotational shift toward defensives.