
When sugar sentiment is not so sweet

Key points
- Sugar has had a terrific run, rallying almost 70% from late October 2022 into September 2023
- Sentiment got a bit overheated as our Sugar Optix indicator soared as high as 84 before backing off
- Historically, when sugar sentiment reverses from an extremely high reading, unfavorable things tend to follow
A look at Sugar Optix extremes
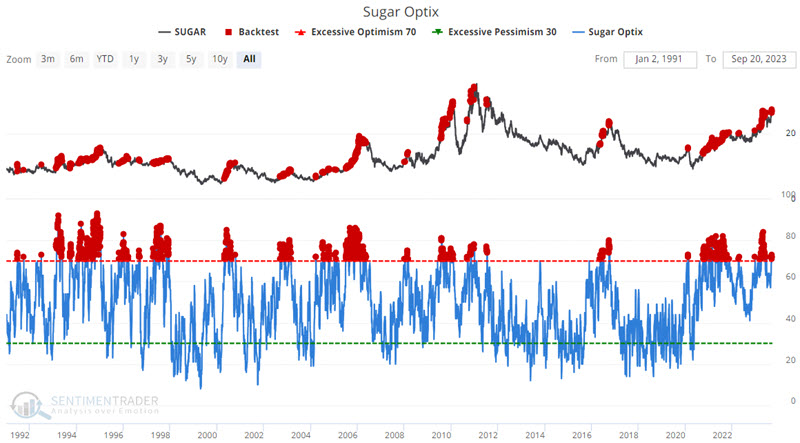
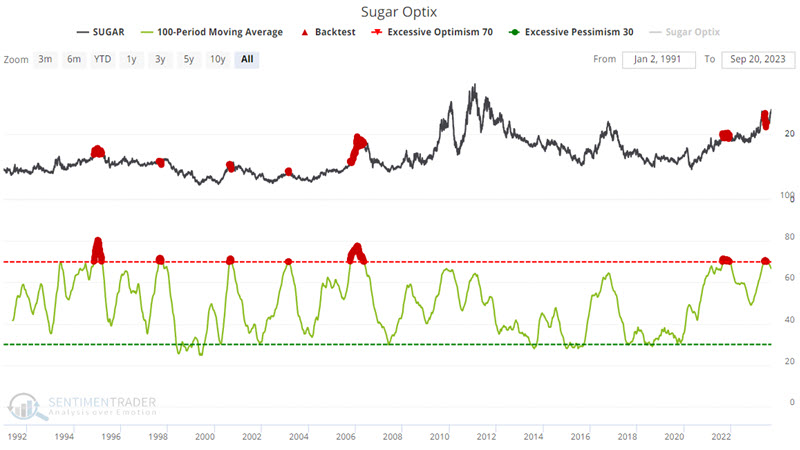
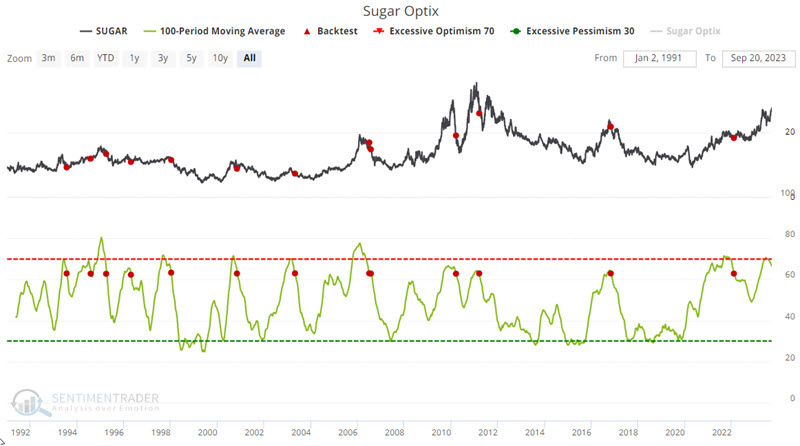
The chart below displays Sugar futures and Sugar Optix sentiment gauge and highlights all days when Sugar Optix was above 70.
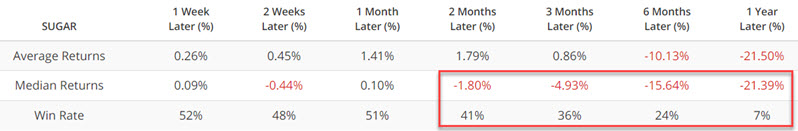
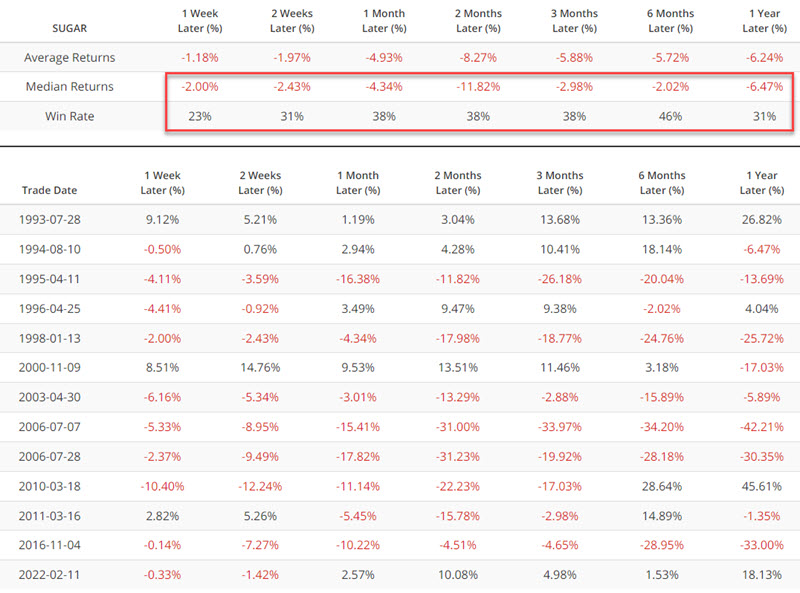
The table below summarizes Sugar futures performance following all daily Optix readings above 70.
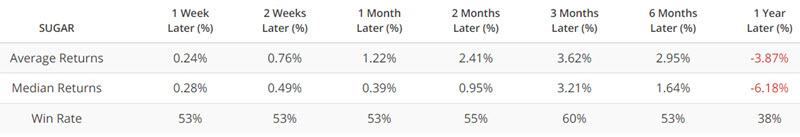
These particular results show a tendency for moderate gains in the short term and a decline over one year. But by themselves, these results are not compelling from a trading perspective. On numerous occasions, Sugar continued to rally sharply higher after Optix rose above 70 before eventually peaking.
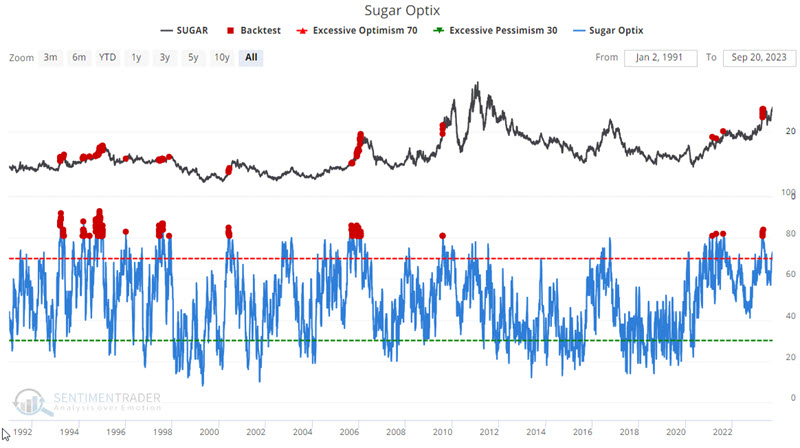
If we raise our threshold to 80, we get similar - albeit slightly more extreme results. The chart and table below display Sugar futures performance after Sugar Optix readings of 80 or more.
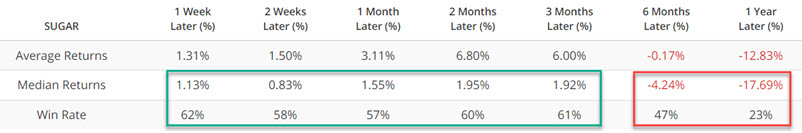
Results are slightly better over three months and notably worse over 6 and 12 months. Regardless, the problem remains the same - too often, Sugar ran to sharply higher levels before topping out.
A longer-term version of Sugar Optix
Let's smooth results using a 100-day moving average of Sugar Optix readings. The chart and table below display Sugar futures performance after the 100-day average for Sugar Optix readings is above 70.
Now we are getting closer to something useful, as 6- and 12-month results are decidedly bearish. However, we see times when a signal involves "selling short into strength."
So, let's consider one more iteration. In this test, we look for the 100-day moving average of Sugar Optix to cross below 70. In other words, instead of looking for a signal while sentiment is becoming more bullish, we will wait for "the bloom to come off the rose," so to speak.
The chart and table below display Sugar futures performance after the 100-day average for Sugar Optix readings crossed below 70.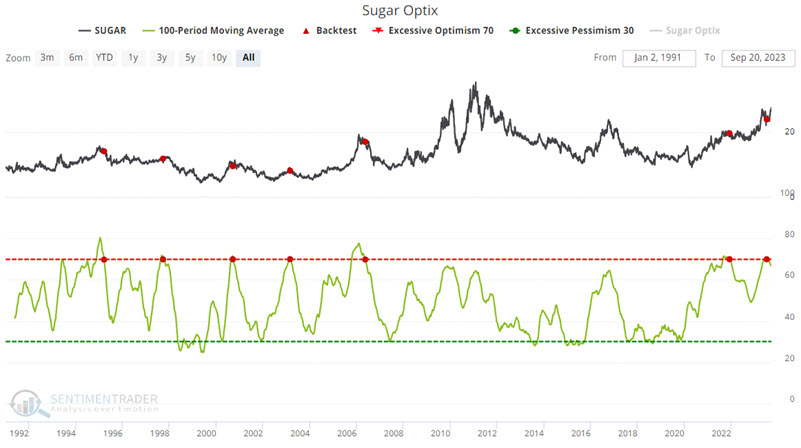
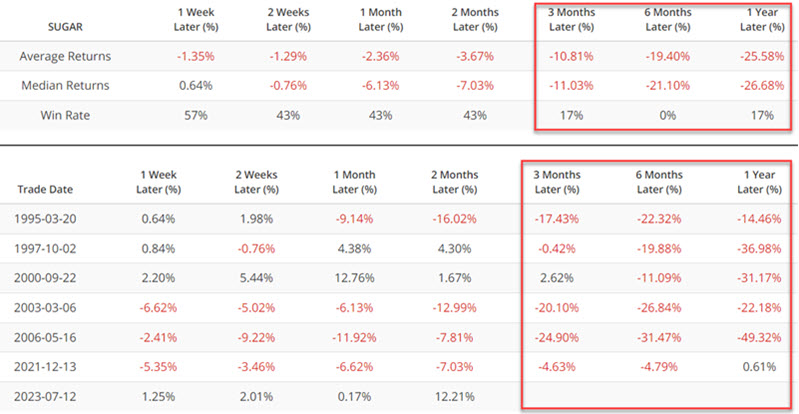
The most recent signal occurred on 2023-07-12. Since that time, Sugar futures have advanced almost 15%. So, one of two scenarios appears likely going forward:
- Either Sugar will continue to rally, and the July 12th signal will go down as a bad signal
- Sugar futures will decline - possibly by a significant amount - in the next 4 to 10 months
One more confirmation to look for
One last "confirmation" iteration to consider would be to wait for the 100-day moving average of Sugar Optix to cross below 63. The chart and table below display Sugar futures performance after the 100-day average for Sugar Optix readings crossed below 63.
Generally speaking, a cross below 63 has acted as a useful bearish trend confirmation signal in the Sugar market.
What the research tells us…
Sugar tends to perform poorly after sentiment reaches a bullish extreme and then reverses lower. But no indicator is guaranteed to work the "next time around." The 100-day average for Sugar Optix crossed below 70 over two months ago. Since then, Sugar has continued to rally, so there is a chance that the July 2023 signal will not pan out. On the other hand, 3, 6, and 12-month returns tend to be where the majority of post-signal weakness occurs. Traders might be wise to watch Sugar closely for signs of weakness - and a potential short entry point - in the weeks and months ahead.