
When NOT to own homebuilders

Key Points
- The recent uptick in interest rates has many investors wondering what effect this will have on the stocks of home builders
- In this piece, we combine price action with interest rate trends to identify when investors are well-advised to eschew the home building sector
Price Action
For measuring price action, we use month-end price for a data series that uses the CRSP home builders sector index from 1963 into 1995 and the S&P 1500 home builders sector index after that. The chart below displays the monthly price for the data series and a 7-month exponential moving average. 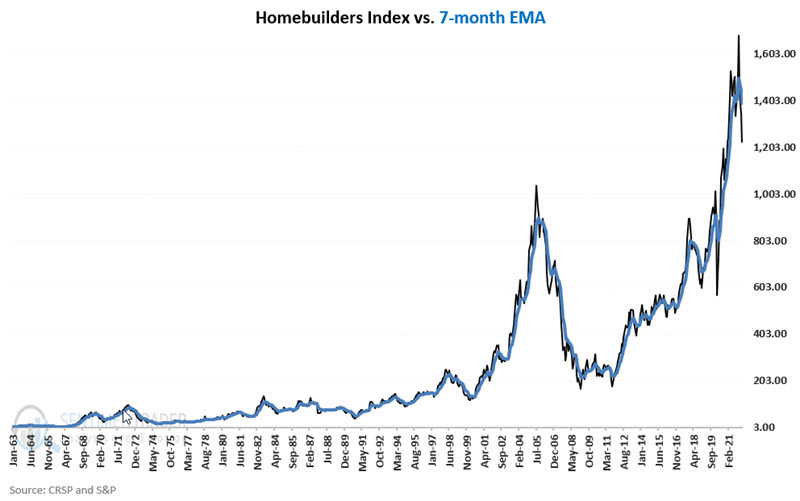
The trend is considered favorable when the month-end price is ABOVE the 7-month EMA and vice versa. The price trend as measured this way has been - and remains - unfavorable since the end of January 2022.
Interest Rates
Conventional wisdom suggests that rising interest rates are bad for homebuilders, as higher mortgage rates reduce buying demand - and vice versa. But how does it actually work out in real life? We compared ticker $TNX (CBOE 10-Year US Treasury Yield Index) to its 7-month EMA to test interest rates. The chart below displays month-end $TNX with a 7-month exponential moving average.
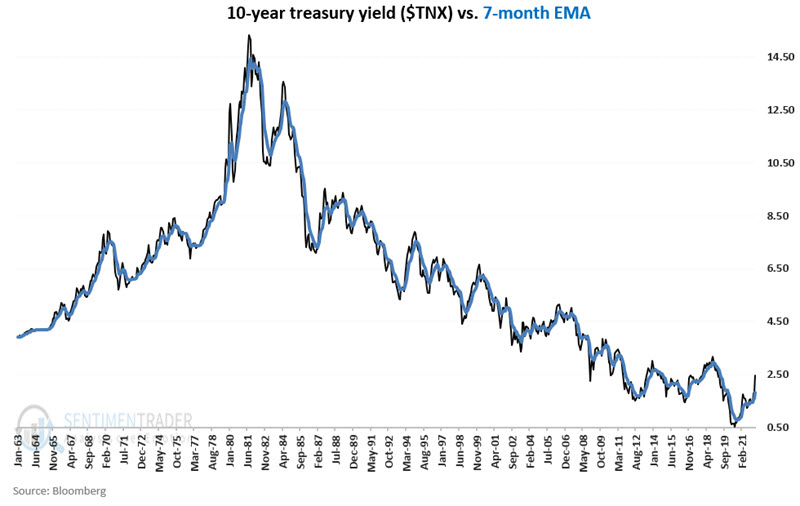
The trend for this indicator is considered favorable when the month-end reading for $TNX is BELOW the 7-month EMA and vice versa. The interest rate trend as measured this way has been - and remains - unfavorable since the end of September 2021.
When price and/or rates are favorable
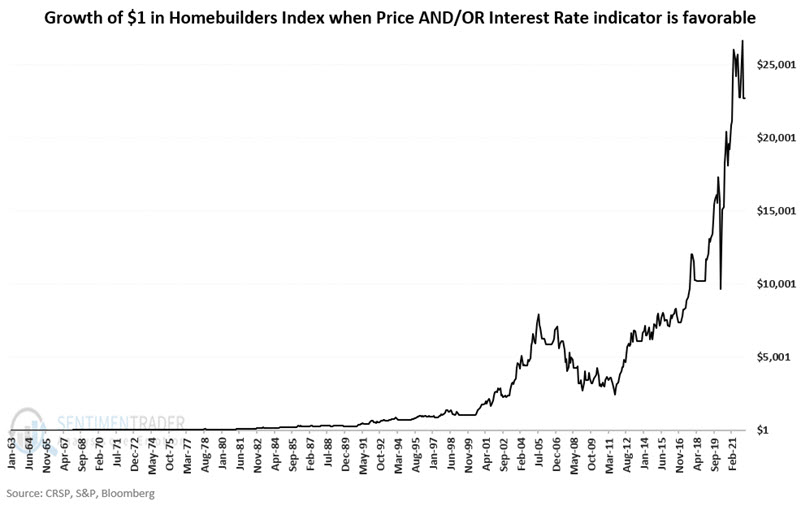
The chart below displays the hypothetical growth of $1 invested in our Homebuilders Index only when at least one of the indicators above closed the previous month with a favorable reading (i.e., either Price > 7-month EMA OR interest rates ($TNX) < 7-month EMA).
The chart below displays the same results in logarithmic format.
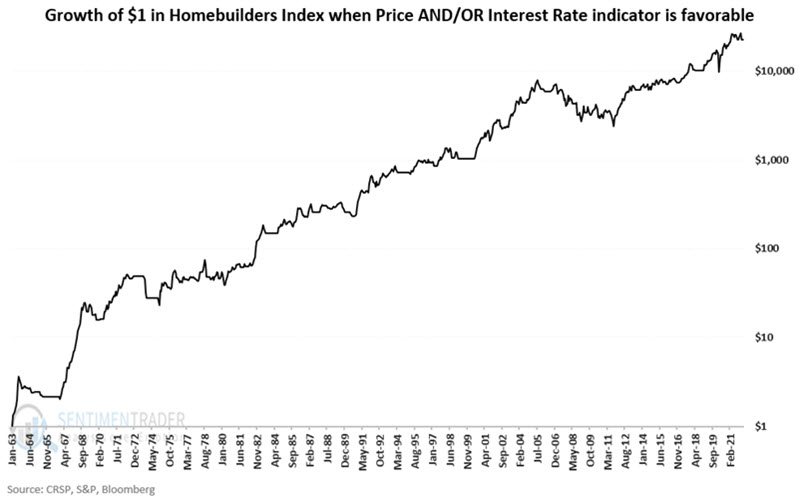
The results are inarguably positive but are also quite volatile and include four separate drawdowns over -40%, including one drawdown of a staggering -69.7% that bottomed in 2011.
But remember, the title of this piece is NOT "When to own homebuilders." The title is "When NOT to own homebuilders." So, let's move on to our real purpose here - determining when to avoid this sector.
When price AND rate are BOTH unfavorable
The chart below displays the hypothetical growth of $1 invested in our Homebuilders Index only when BOTH of the indicators detailed above closed the previous month with an unfavorable reading (i.e., Price < 7-month EMA AND interest rates ($TNX) > 7-month EMA).
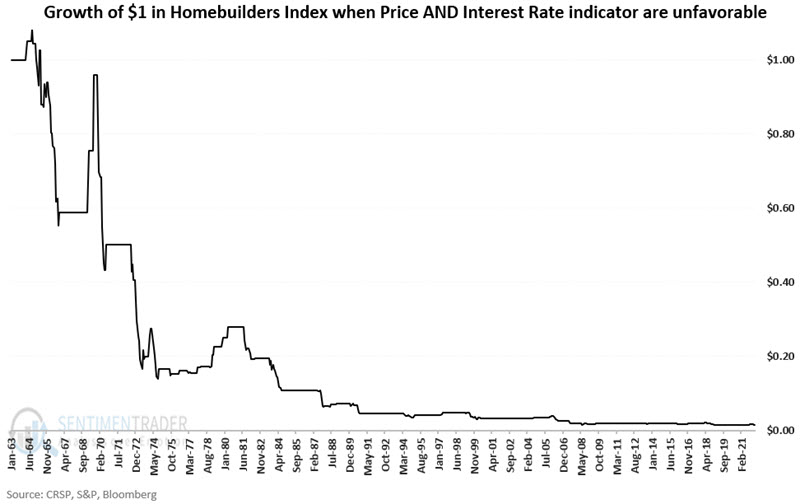
Holding homebuilders when both of the indicators detailed above are unfavorable would have resulted in a staggering loss of -98.7% heading into late March 2022. There have been periods when homebuilders rallied sharply under these circumstances - notably in 1969 and 1979-1980. But since 1980 - and as shown in the chart below - the devastation has been fairly relentless when both indicators are deemed unfavorable for homebuilders.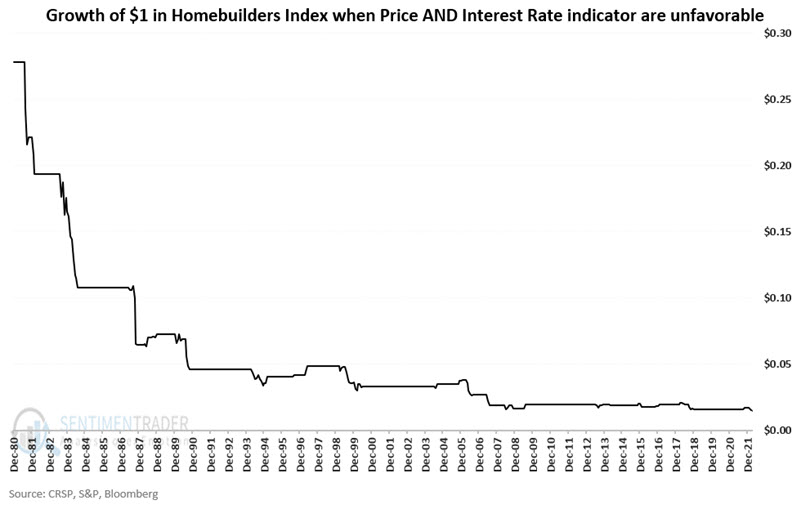
Real-world application
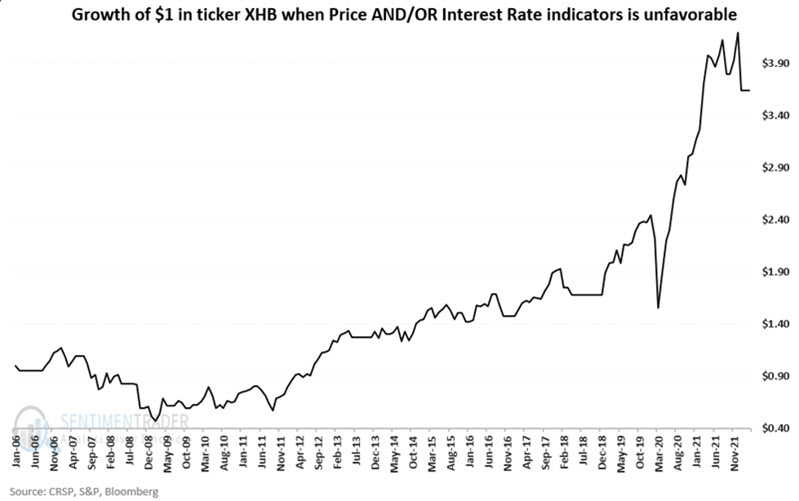
Using the indicators above, let's look at the performance of XHB (SPDR S&P Homebuilders ETF) during favorable and unfavorable periods since this ETF started trading in 2006. This ETF holds a portfolio of homebuilder and homebuilding-related stocks and enjoys a correlation of roughly 94% with our homebuilder's index.
The chart below displays the growth of $1 held in XHB only when either indicator is favorable.
The chart below displays the growth of $1 held in XHB only when both indicators are unfavorable.
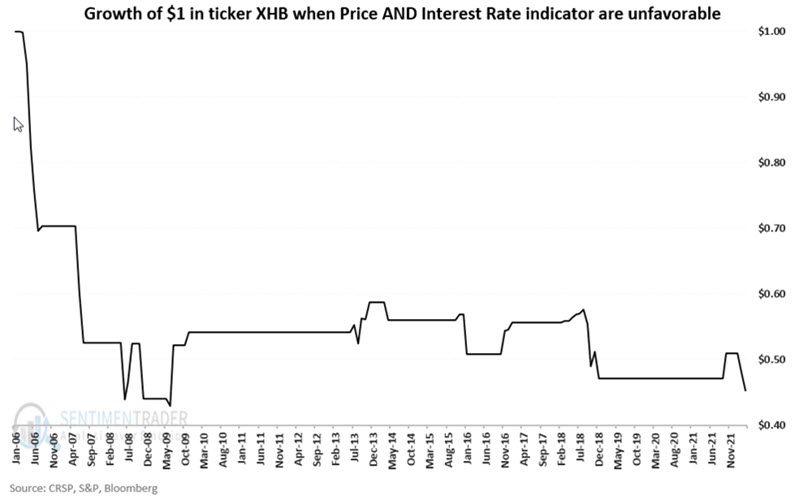
XHB gained +264% while either indicator was favorable and lost -55% while both indicators were unfavorable heading into late March 2022.
What the research tells us…
Since January 31st, 2022, both price and interest rates have been unfavorable for homebuilders. Since then, the Homebuilders Index we follow has been down over -14%, and XHB has been down over roughly -12%. Both indicators will remain bearish at the end of March and into April.
Does this mean that homebuilding stocks are cannot possibly rally and are doomed to decline further? Not at all. Strong countertrend rallies can happen at any time. Nevertheless, the results above suggest that a trader ought to have some highly compelling reason to play the long side of the home building sector at this time.