
When not to own bank stocks - Part II

Key Points
- The banking sector has exhibited a highly cyclical nature for a number of years
- KBE's annual seasonal trend reveals many twists and turns
- While the annual trend is not a roadmap, it can offer significant clues
The banking sector proves a choppy affair
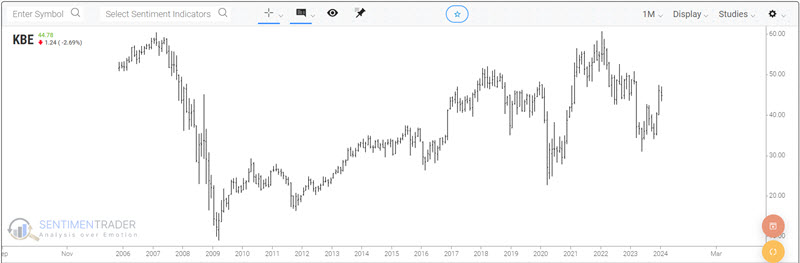
In the monthly chart for the SPDR S&P Bank ETF (ticker KBE), there appears to be little rhyme or reason to price movements.
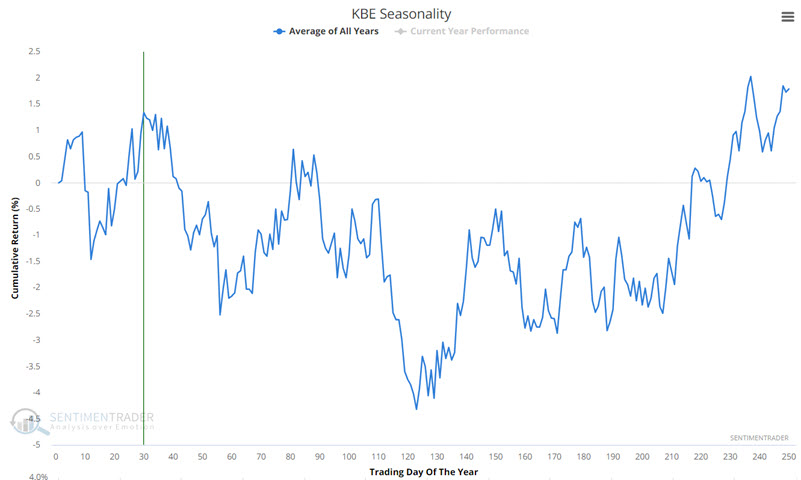
However, if we analyze performance across each calendar, a pattern - albeit a highly volatile one - emerges. The chart below displays the annual seasonal trend for ticker KBE. Note the many twists and turns from favorable to unfavorable and back again.
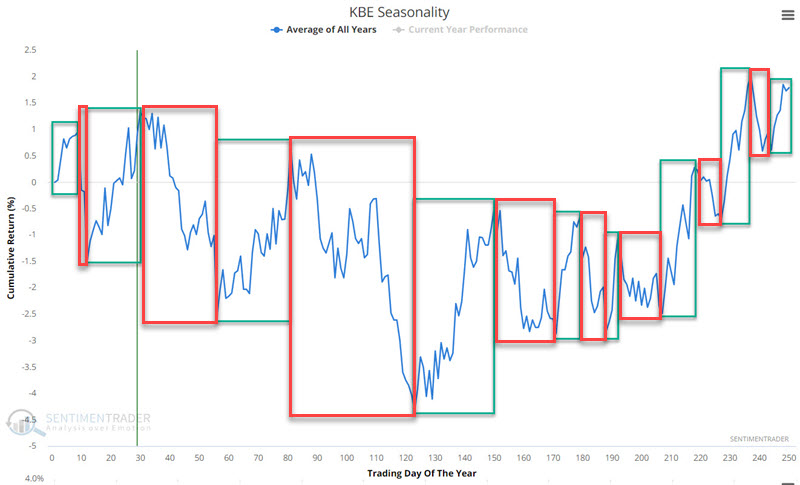
It is important to remember that the annual seasonal trend is nothing more than the average of actions in previous years (and thus - yes - generated with the benefit of hindsight) and that it is not a roadmap to what will happen every year going forward. The chart below highlights the many alternating favorable and unfavorable seasonal periods.
This type of choppy price action can offer short-term traders many opportunities. The table below breaks down the various periods regarding Trading Day of the Year (TDY #). It also includes turning point dates for 2024.
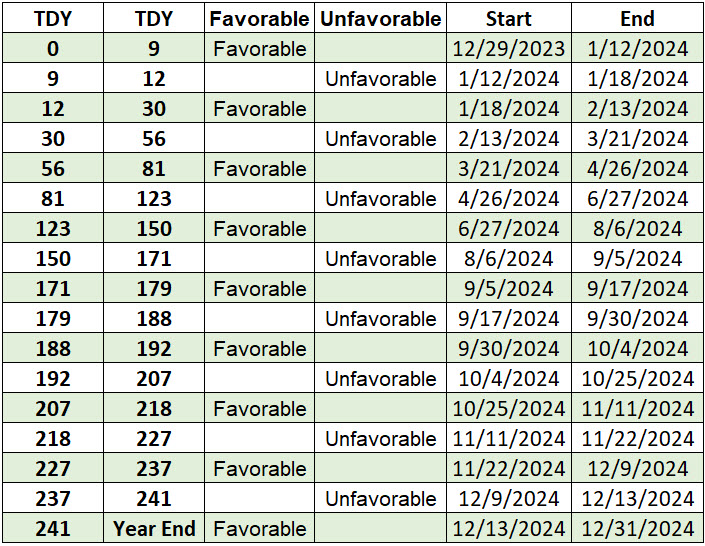 Will the dates in the table above mark exact turning points for KBE during 2024? Almost certainly not (remember, it is not a roadmap!). The real key to using this information is to:
- Look for opportunities to play the long side during favorable periods
- Stand aside or play the short side during unfavorable periods
A closer look at favorable periods
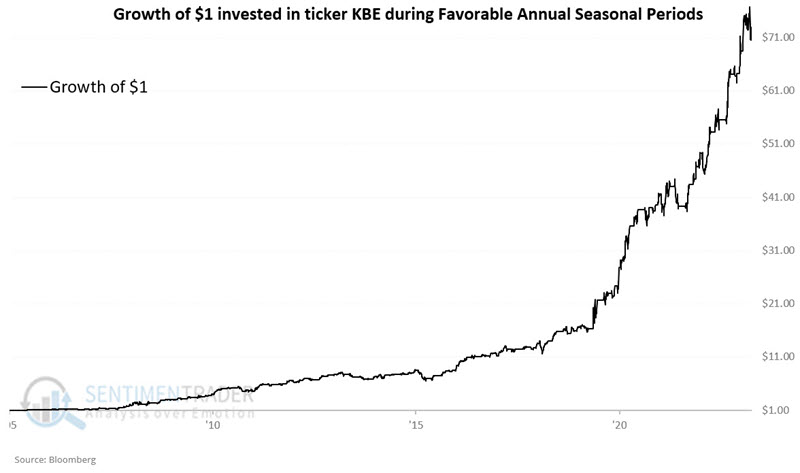
The first test assumes that one is invested in ticker KBE each year only during the periods marked "Favorable." The chart below displays the hypothetical growth of $1 invested in KBE only during the favorable periods since KBE started trading in 2005.
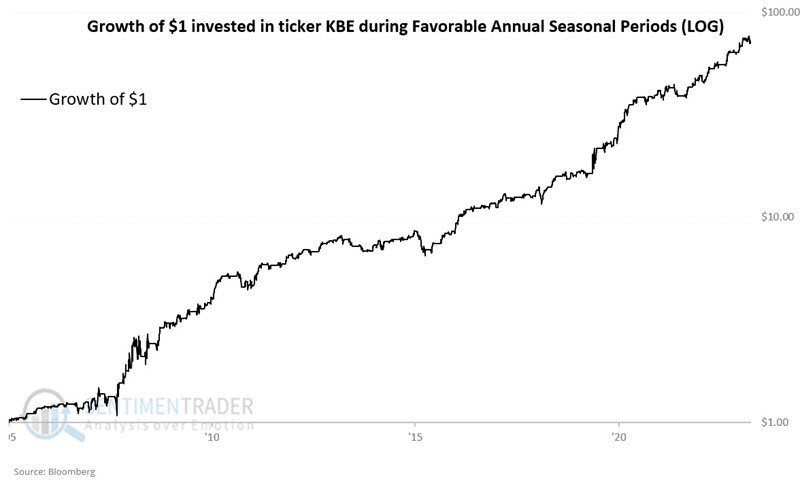
The chart below displays the same results on a logarithmic scale.
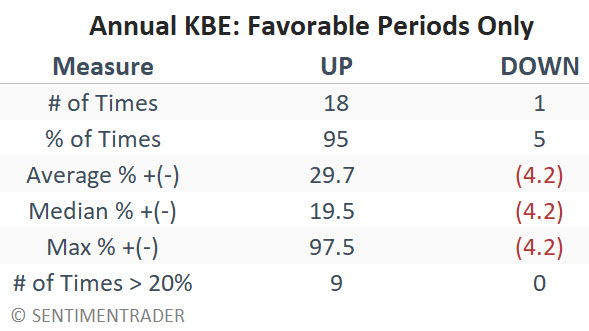
The table below summarizes KBE's annual performance if held only during favorable seasonal periods.
The results are compelling. However, KBE is NOT recommended to be traded systematically based solely on the seasonal calendar. Note that results are hypothetical and assume a trader takes all positions exactly as signaled and does not include any adjustments for slippage or commissions.
A closer look at unfavorable periods
While the results above are compelling, there is no guarantee of profit if KBE is held during the favorable periods. Likewise, there is no guarantee that large drawdowns will not occur. In any event, remember that the title of this piece is "when NOT to trade KBE."
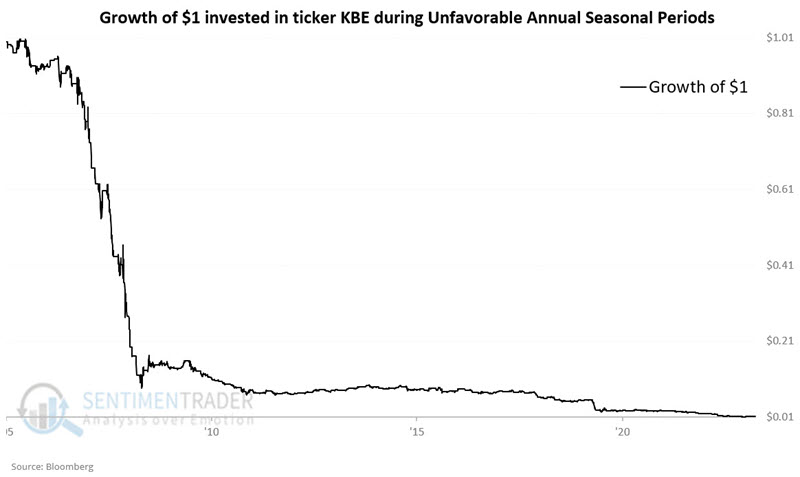
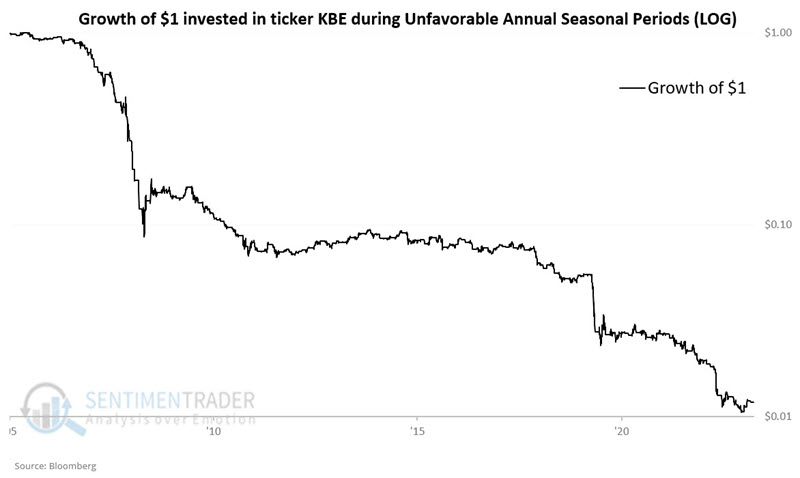
Our next test assumes that one is invested in ticker KBE each year only during the periods marked "Unfavorable." The chart below displays the growth of $1 invested in KBE each year only during these periods.
The chart below displays the same results on a logarithmic scale.
The table below summarizes KBE's annual performance if held only during unfavorable seasonal periods.
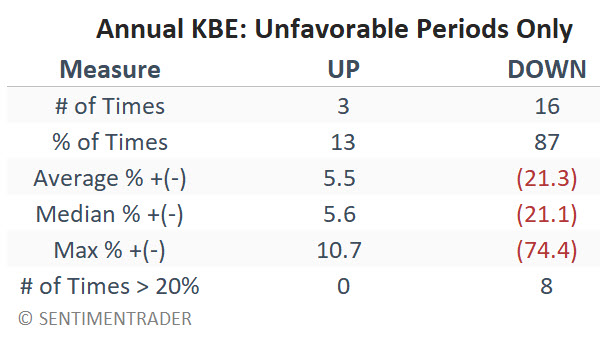
During any given unfavorable period, anything can happen. Likewise, past performance never guarantees future results. That said, you can see in the chart above why investors might think twice about investing in bank stocks during unfavorable periods.
What the research tells us...
If I were a marketing guy, at this point, I would spew some bombast about "the hidden order" in banking stocks and get everyone's speculative juices flowing. Alas, it's broken record time. The results above are generated by looking backward at historical KBE performance and assuming given periods were "favorable" or "unfavorable" every year. The results (historically) have been remarkably consistent. That said, seasonal trends are never - and should never be expected to be - perfect going forward. Seasonal trends serve merely as "just another indicator" that purports to suggest the price trend in the future. With that limitation and adjusted expectation in mind, trading in the direction of an expected seasonal trend - particularly when price action confirms the expected trend - can be surprisingly lucrative. That said, a trader is never relieved of their responsibility to allocate capital intelligently and to manage risk ruthlessly - regardless of what indicator or group of indicators suggest.