
When not to own bank stocks

Key Points
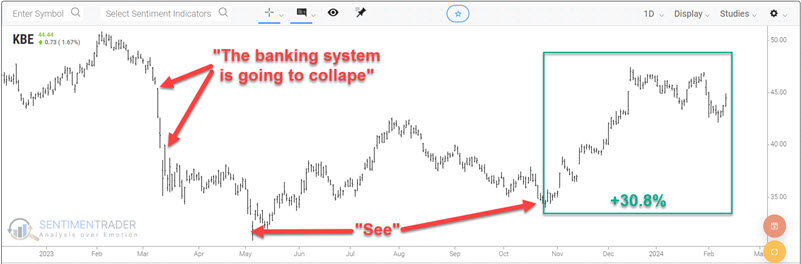
- In early 2023, pundits suggested that the banking system was going to collapse
- Investors who panicked and heeded those warnings have gotten left behind
- Bank stocks have tended to show weakness in the months ahead
Banking surprised the pundits
When SVB collapsed last year, cable news was full of stories about "the coming banking collapse." Even into October of 2023, the drumbeat continued. Then - as you can see from the chart below - the banking sector caught fire, and the SPDR S&P Bank ETF (ticker KBE) rallied over +30%.
So, has the banking sector cleared the atmosphere, and is it ready to continue to run? It could be. However, if history proves an accurate guide in 2024, it may be time to be a little less aggressive in this sector.
The late winter/early spring lull
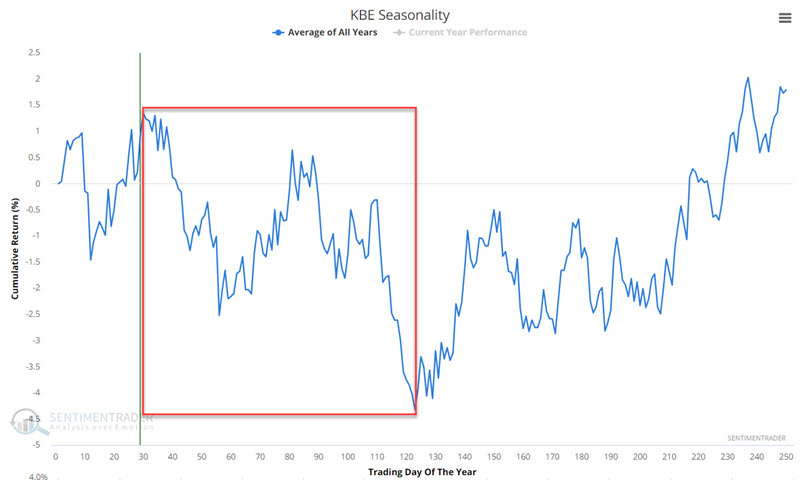
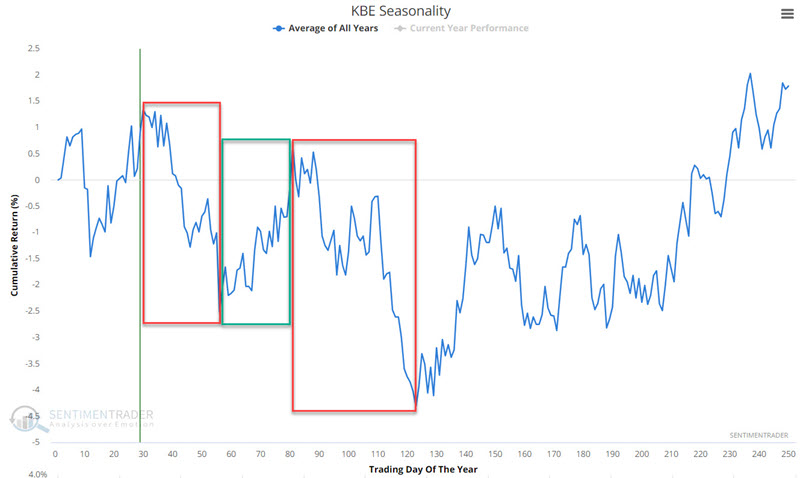
The chart below displays the annual seasonal trend for ticker KBE. Note the tendency for weakness from Trading Day of Year #30 through TDY #123. For 2024, this period extends from the close on 2024-02-13 through the close on 2024-6-27.
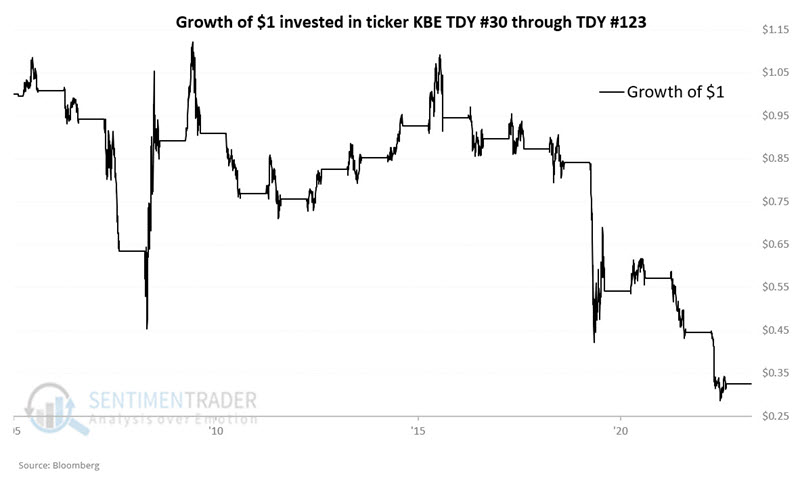
The chart below displays the growth of $1 invested in KBE from TDY#30 through TDY #123 since KBE started trading in 2005.
The table below summarizes KBE's performance during this period.
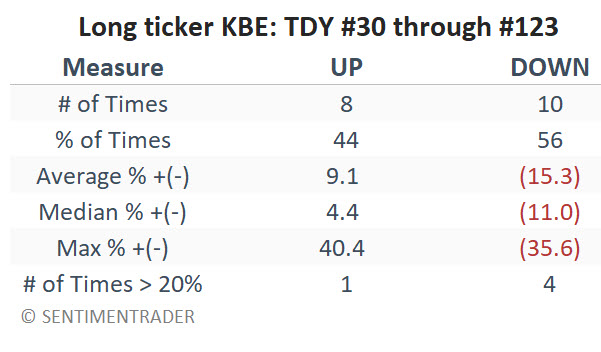
So, are banks doomed to decline between now and late June? That is NOT really the message here. A 44% Win Rate merely implies that historical odds may be less than average and that investors may be able to find better opportunities for the months ahead. The other concern is that if the banking sector struggles in the months ahead, it could involve a sizeable decline. There have been four times that KBE has declined more than 20% during this period, plus another decline of -15.4% in 2011.
The message is not necessarily "sell bank stocks." But at the very least, the phrase "locate the nearest exit and stand ready to act" would seem to apply.
Cutting things a little finer
The chart below also displays the annual seasonal trend for ticker KBE but splits the unfavorable period highlighted above into three segments - two down and one up.
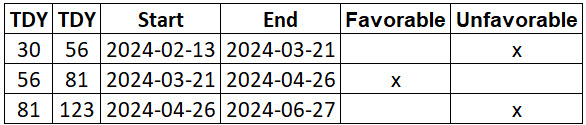
The table below shows the cutoff dates for 2024 for the periods highlighted above.
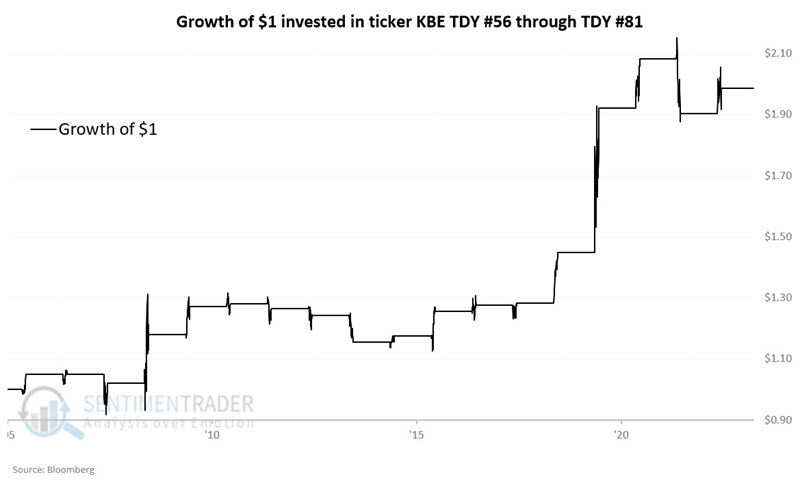
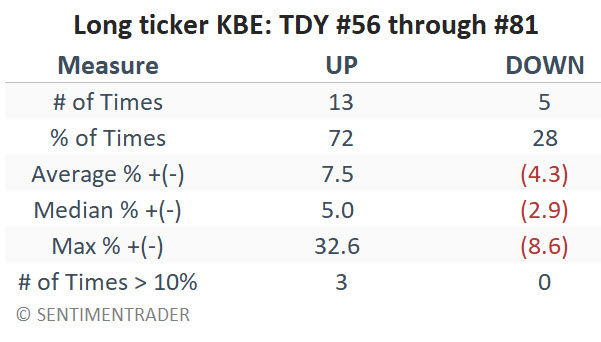
Let's focus first on the period in the green box in the chart above, extending from TDY #56 through TDY #81. The chart and table below summarize KBE's performance during this period.
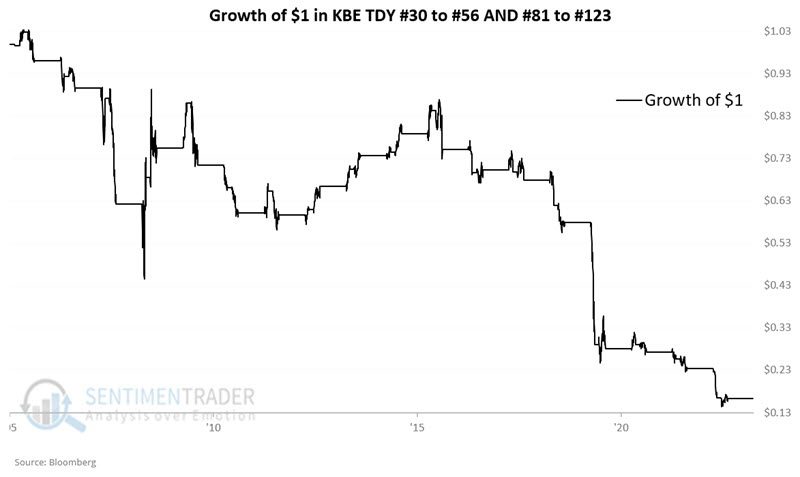
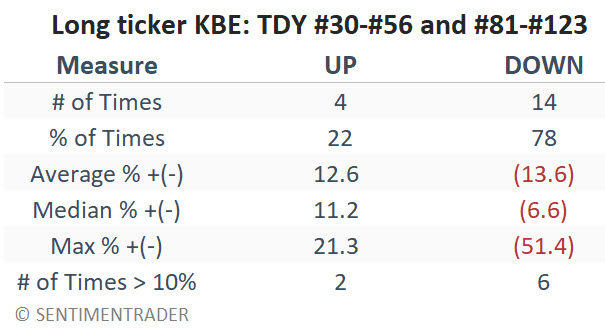
Next, let's combine KBE's performance during the two unfavorable periods in the chart above. In other words, the chart and table below display performance if an investor was long KBE only from TDY #30 through #56 AND TDY #81 through #123 every year since 2005.
What the research tells us...
Historical results show a tendency for weakness in banking stock during the February through June period. But remember, we are talking about "tendencies" and not "certainties." The message in the data above is not necessarily that investors should presently sell any banking stocks they hold. These questions capture the real message to ponder: "Are bank stocks the best place to have your money invested for the months ahead, or can you identify better opportunities."