
When momentum continues despite an overbought condition

Key points:
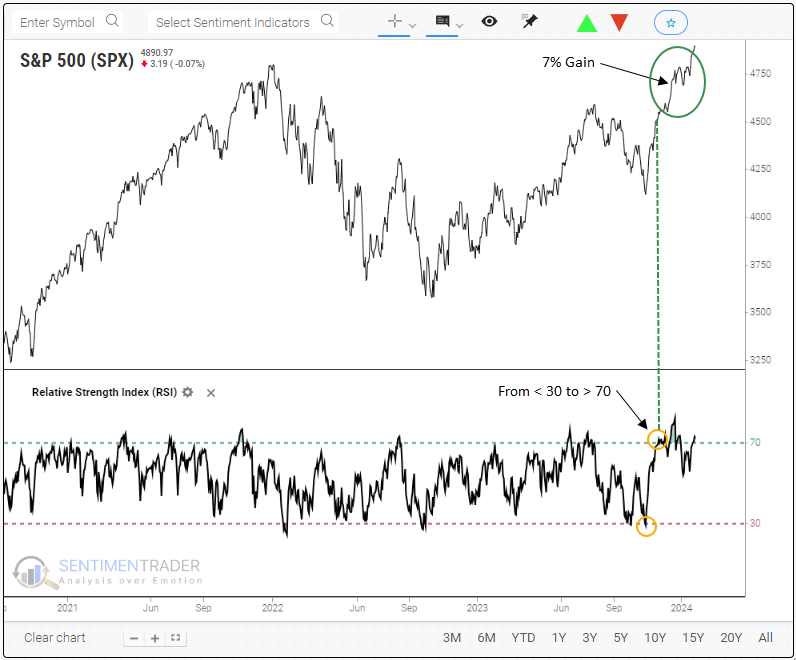
- The RSI for the S&P 500 Cycled from < 30 to > 70, and the Index gained 7% over the subsequent two months
- Comparable price momentum signals led to a short-term pause within the context of an uptrend
Positive momentum begets more positive momentum
The S&P 500 Relative Strength Index (RSI) cycled from below 30 (oversold) to above 70 (overbought), triggering a bullish price momentum signal on 2023-11-20.
That alert registered a significant achievement at the two-month mark last week, with the S&P 500 recording its most substantial return since July 2009, gaining 7%.
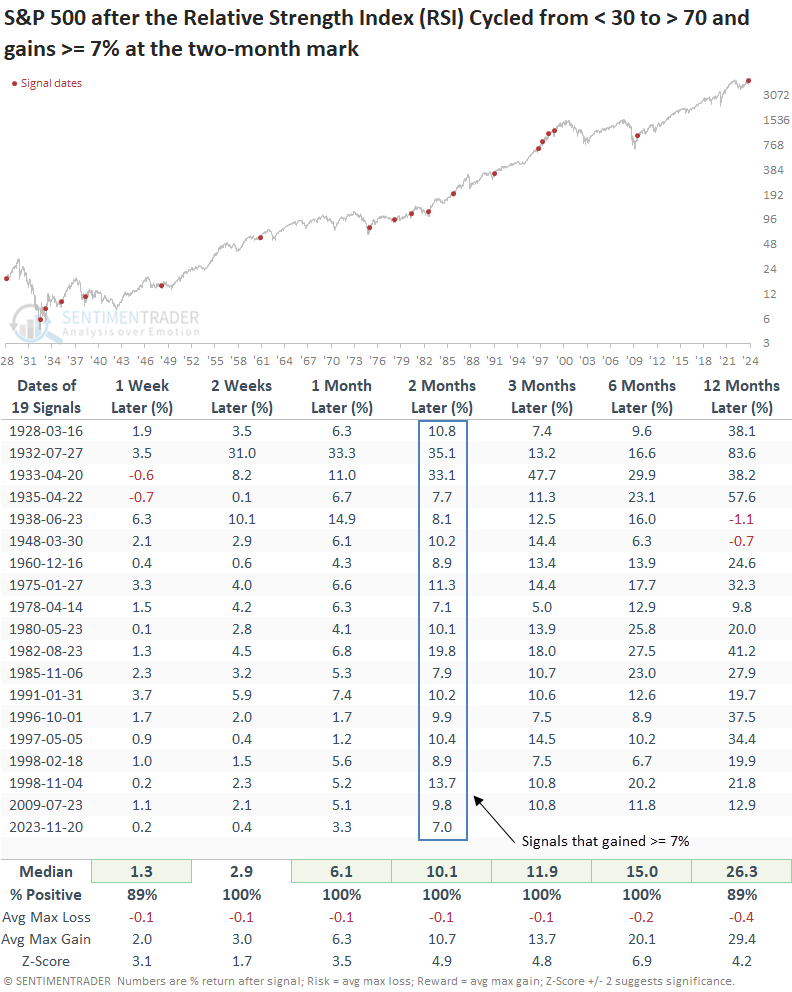
Let's assess the outlook for the S&P 500 after its Relative Strength Index (RSI) transitioned from under 30 to above 70, followed by an index surge of 7% or more over the ensuing two months.
Don't fear the RSI overbought condition
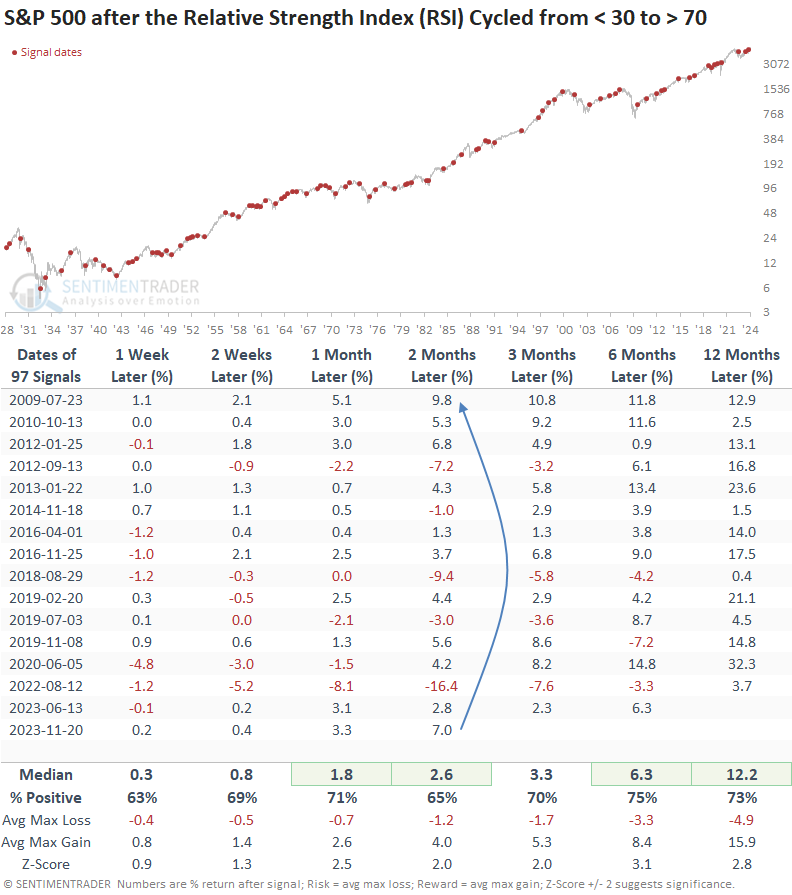
Since 1928, the Relative Strength Index (RSI) for the S&P 500 has cycled from oversold to overbought 97 times. Returns, win rates, and z-scores were excellent across most time frames, indicating that positive price momentum tended to persist despite the overbought condition.
The 7% return at the two-month mark ranks as the best gain since the July 2009 signal.
Suppose I isolate all the RSI oversold to overbought reversal signals with a gain of 7% or more at the two-month horizon, like now. In that case, I found 19 alerts.
Results are nothing short of spectacular when measured from the original signal dates.
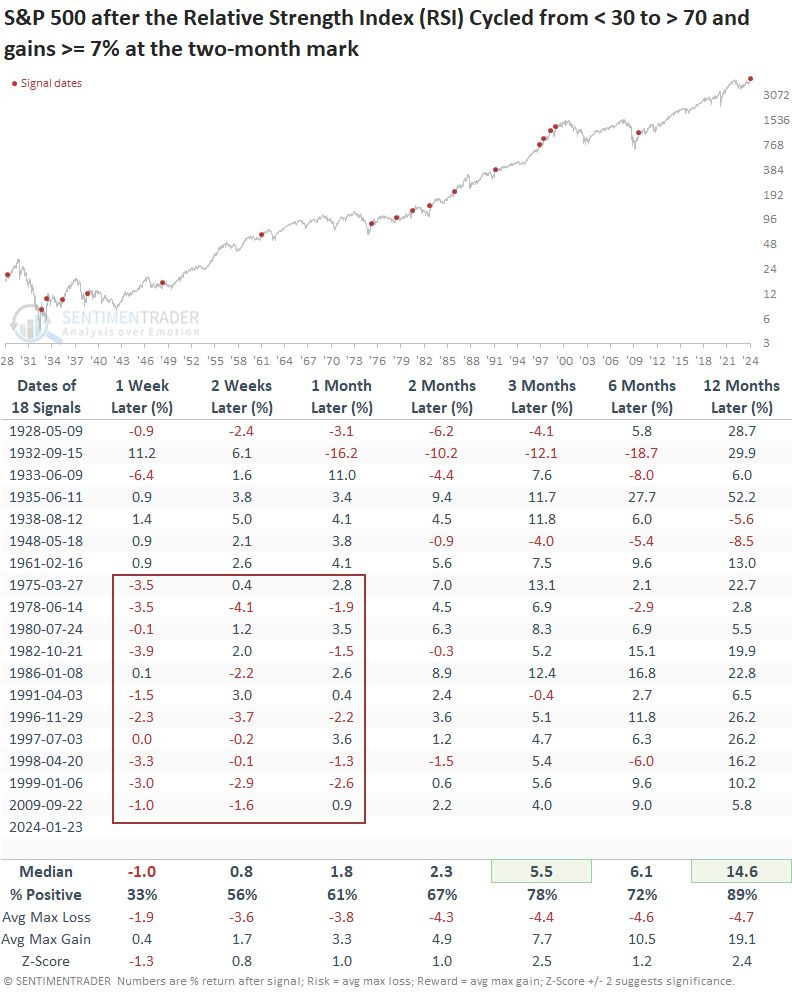
What happens on a go-forward basis from the two-month mark?
If I project the date two months forward from the original signal dates, the S&P 500's outlook hints at a potential pause in the world's most benchmarked index over the next month. That was especially the case since 1975, with all 11 precedents displaying losses at some point over that same time frame.
However, this is likely a temporary pause, serving to reenergize the uptrend in the S&P 500. A year later, the index was higher 89% of the time.
Backtest Engine
Harness the power of the new backtest engine to create and monitor trading signals similar to the one highlighted today.
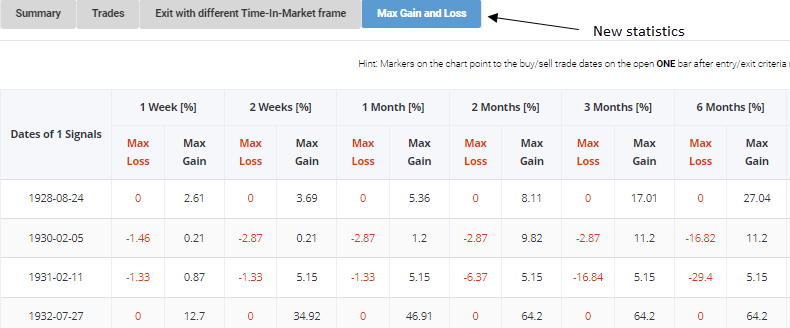
As part of our ongoing commitment to product improvement, the Backtest Engine's results page now includes a comprehensive table featuring the maximum gain and loss on a signal-by-signal basis.
What the research tells us...
The S&P 500's Relative Strength Index (RSI) cycled from less than 30 to greater than 70, and then the index rallied 7% over the subsequent two months. Assessing all RSI oversold to overbought reversal signals that gained 7% or more at the two-month horizon suggests the world's most benchmarked index could consolidate the recent gains. Still, it's most likely a pause that refreshes with the index rising 89% of the time over the subsequent year. When indexes stall, some stocks go up, and some go down. So, it's critical to let winners run while cutting losses short for underperformers.