
When in doubt, you have options

Key points
- There is more than one way for gold bulls to participate in the gold market
- Buying shares of ticker GLD is one alternative - however, it can require a significant of cash
- Buying a call option is an alternative to buying shares; however, that too comes with its own pros and cons
- A 231 Butterfly spread might hold greater appeal for a trader with a particularly bullish short-term outlook
What is gold doing?
You will get many different answers if you ask different traders which way gold is headed next. Some will argue that gold is forming a long-term cup-with-handle formation and that it will be off to the races as soon as it breaks out above the previous high. Others will argue that it has put in multiple tops and is headed lower.
I will not pretend to know who is right and who is wrong. The purpose of this piece is not to attempt to predict which way gold is headed next. It is simply to highlight some alternative ways to play that you might not have considered. For example, we will take the perspective of a trader who believes the recent low will hold and that gold will bounce higher in the near term (again, to be clear, that is not a prediction, just an example).
For what it is worth, this article ostensibly makes a bullish case for gold in the relatively near term.
Buying shares of GLD
The most straightforward approach for a bullish trader would be to buy gold futures. However, this entails unlimited risk and a great deal of leverage. So let's stick to an ETF alternative that any investor might trade in their stock account. The most straightforward approach for a trader bullish on gold would be buying 100 shares of the SPDR Gold Shares ETF (ticker GLD). As this is written, GLD is trading at $177.03 a share. The cost to buy 100 shares would be $17,703. For each $1 GLD price rise, the trade will gain +$100, and vice versa.
The particulars and risk curves appear in the figures below.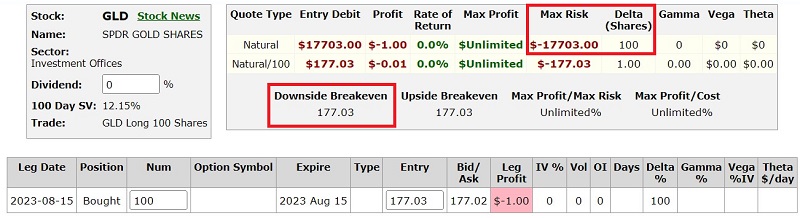
The sticking point for a trader who thinks gold "might" rally - but does not have a high degree of conviction - is the outlay of $17K+, and that capital is tied up as long as the position is held. So let's consider a simple alternative.
Buying a call option on GLD as an alternative
As you can see in the chart below, gold is presently in a favorable seasonal period.
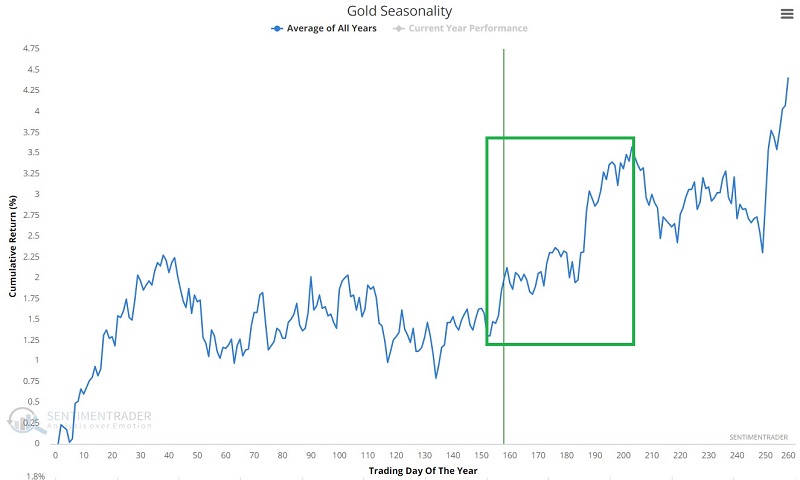
This does not in any way guarantee that gold is about to rally. But it does suggest a potential upward bias between now and mid-October. For a trader who wants exposure to the long side of gold but who also does not want to trade gold futures nor lay out almost $18K to buy 100 shares of GLD, one alternative is to buy a call option on ticker GLD as follows:
- Buy 2 GLD Oct20 2023 180 calls @ $3.00
The particulars for this trade and the risk curves (the expected $ gain or loss as of a given price for GLD as of a given date) appear below (courtesy of Optionsanalysis.com).
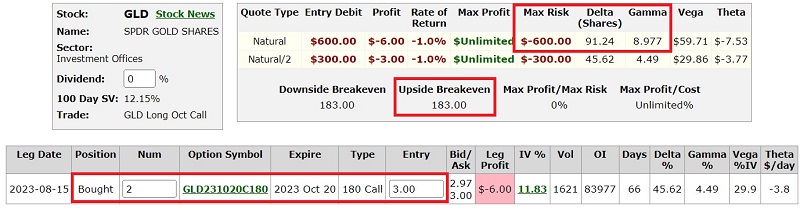
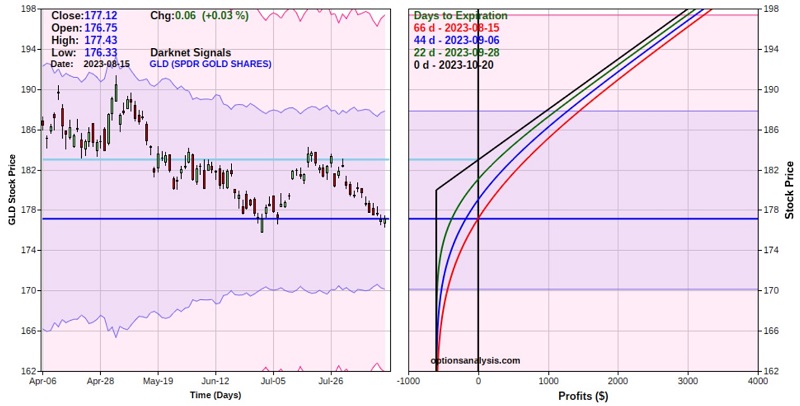
Things to note:
- The cost to enter the trade - and the maximum risk - is $600
- The trade has unlimited profit potential between now and the October option expiration
- The breakeven price is $183 - i.e., if held until October expiration, GLD must be above this price for this option position to show a profit
- The position has a delta of 91.24, which implies that it is roughly equivalent to holding long 91 shares of GLD
- The position has a gamma of 8.977, which means it will gain roughly nine deltas for each $1 GLD rises in price
The good news is that a trader buying this call option has more profit potential than someone who bought 100 shares of GLD at 3.3% of the cost ($600 outlay versus $17,703 to buy 100 shares of GLD). The option trader also enjoys unlimited profit potential (just like the shareholder) and limited risk (unlike the shareholder, who will continue to lose $100 for each point GLD might decline in price).
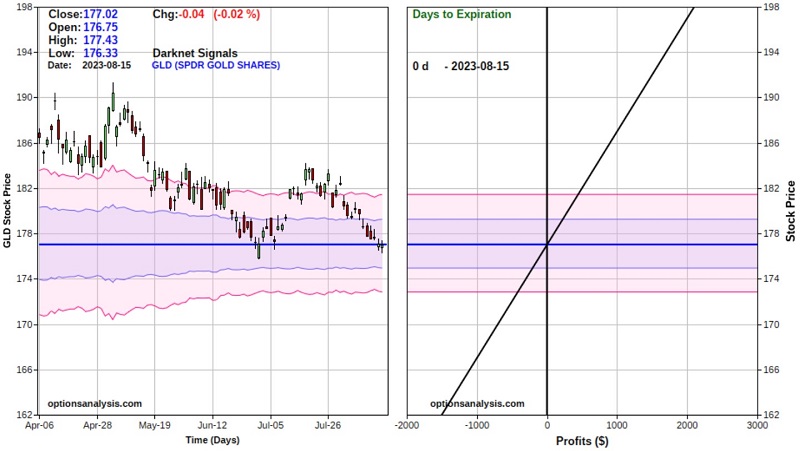
Of course, as they say, "There is no free lunch." The chart below overlays the risk curve for the long stock position (black line) versus the long October call position (colored lines).
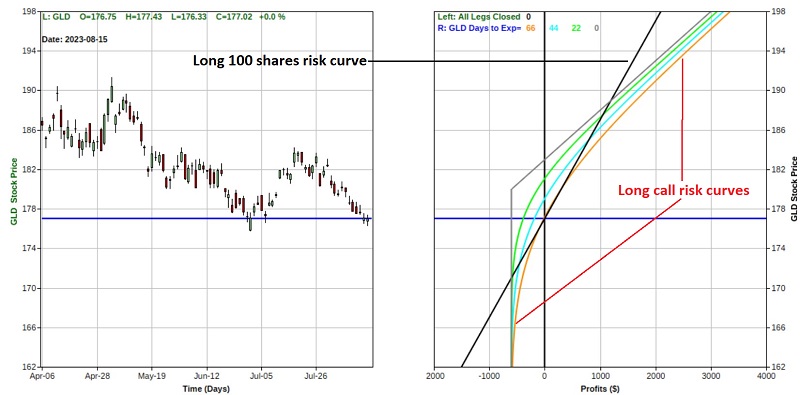
Above roughly $188 a share, the call option holder will profit more than the shareholder. Also, below approximately $171 a share, the call option holder will lose less than the shareholder. However, between the price of roughly $171 and $188 a share, the option trade could make less or lose more than the long 100 shares position. This is due to the time decay associated with option trading (i.e., all options lose all of their time premium by the time of expiration).
So is the option trade better or worse than the long 100 shares trade? That is up to each trader to decide for themselves.
To cover all the bases, let's consider one more alternative option strategy.
The 231 Butterfly spread
The 231 Butterfly spread involves:
- Buying 2 call options at one strike price
- Selling 3 call options at a higher strike price
- Buy 1 more call option at an even higher strike price
Let's consider an example using options GLD as follows:
- Buy 20 GLD Oct20 2023 189 calls @ $0.77
- Sell 30 GLD Oct20 2023 194 calls @ $0.38
- Buy 10 GLD Oct20 2023 199 calls @ $0.21
The particulars and risk curves for this position appear below.
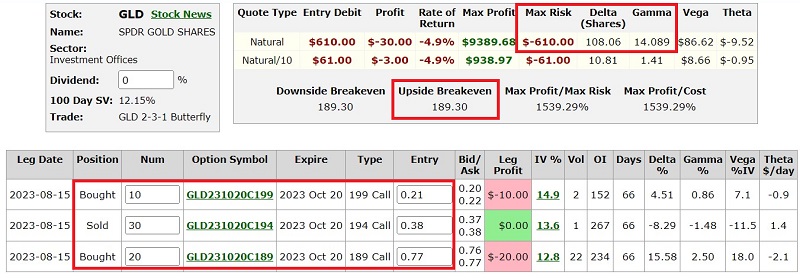
Things to note:
- The cost to enter the trade - and the maximum risk - is $610
- The trade does not have unlimited profit potential. The risk curves start to flatten out and/or decline if GLD reaches the short strike of $194 a share
- The breakeven price is $189.30 - significantly higher than the long shares or long call position; however, it has a higher delta and gamma than the long call position
- The position has a delta of 108.06, which implies that it is roughly equivalent to holding long 108 shares of GLD
- The position has a gamma of 14.09, which means it will gain that many deltas for each $1 GLD rises in price
The bottom line is that - at least initially - the 231 Butterfly spread has more immediate upside potential than the long shares or long call position. This is because it has a higher delta (stock equivalent position), which can rise significantly as the price increases due to a higher gamma.
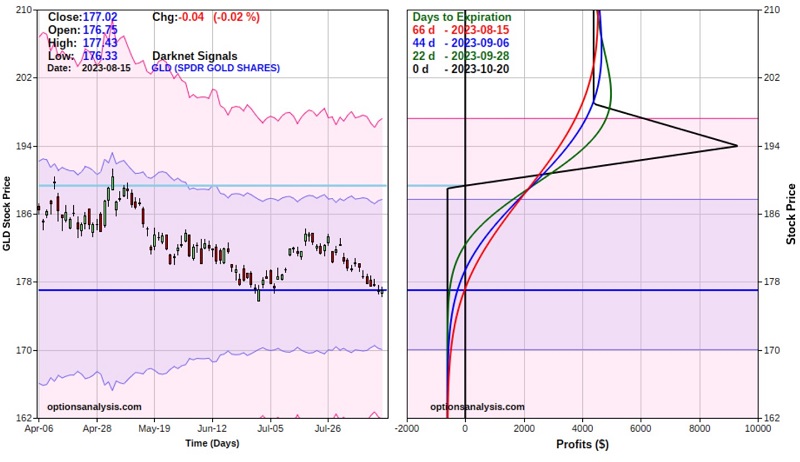
The chart below overlays the risk curves for the long stock position versus the 231 Butterfly spread. The straight black line represents the profit/loss outlook for the long 100 shares of GLD position. The colored lines represent the expected profit/loss outlook for the 231 Butterfly spread as of four dates leading up to options expiration (which is the grey line).
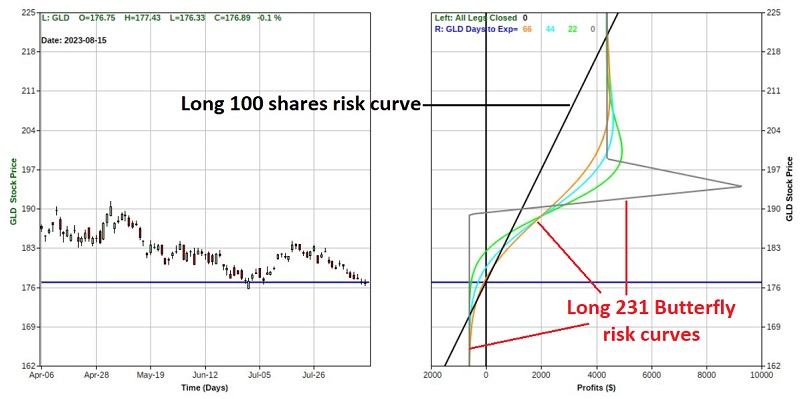
There are obvious tradeoffs:
- From roughly $190 to $221 a share for GLD, the 231 Butterfly spread enjoys (at times, significantly) more significant profit potential
- Between roughly $171 and $190, the 231 Butterfly spread is at risk of making less or losing more than the long 100 shares position
- Below $171, the 231 Butterfly spread enjoys limited risk
Comparing the Long call position to the 231 Butterfly spread
The chart below displays the risk curves for the long call position versus the 231 Butterfly spread to complete the comparisons.
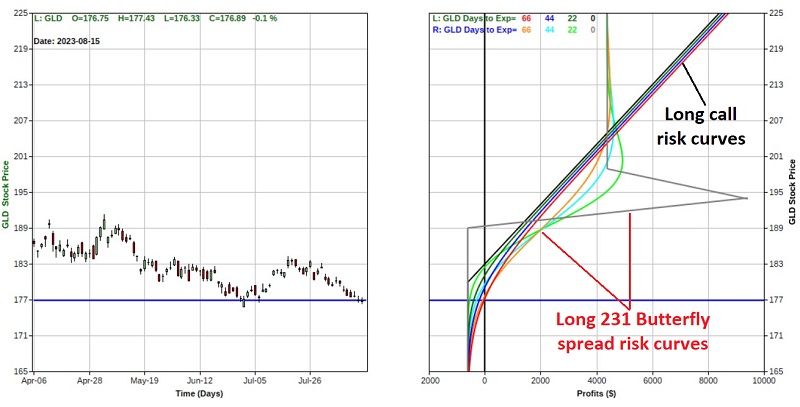
Again, there are tradeoffs:
- Above roughly $205 a share for GLD, the long call enjoys unlimited profit potential versus limited potential for the 231 Butterfly spread
- Between approximately $188 and $205, the 231 Butterfly spread enjoys significantly greater profit potential
- Both trades entail a total risk of roughly $600
What the research tells us…
If you expect a quick reversal and rally in GLD, the 231 Butterfly spread offers the most bang for the buck initially (especially if you have a price target between $188 and $205 a share).
If you believe that GLD could explode upward beyond $205 a share between now and the October option expiration, the long call position offers unlimited profit potential at the cost of only $600
If you believe GLD will rally but are not confident it will do so by the October option expiration, buying 100 shares of GLD (which you can hold indefinitely) might make sense. One other alternative would be to enter an option position using options that expire further in the future.