
When Crude Oil Meets the Second Half of November

Key points:
- In what has generally been a good year for commodities, crude oil has been a clear laggard
- Even though crude oil's poor relative performance is getting a bit overdone to the downside, and that a reversal of fortune may be near, we presently have to counsel patience
- The period between now and the first of December has typically been a tough time to play the long side
How crude oil tends to act during this time of year
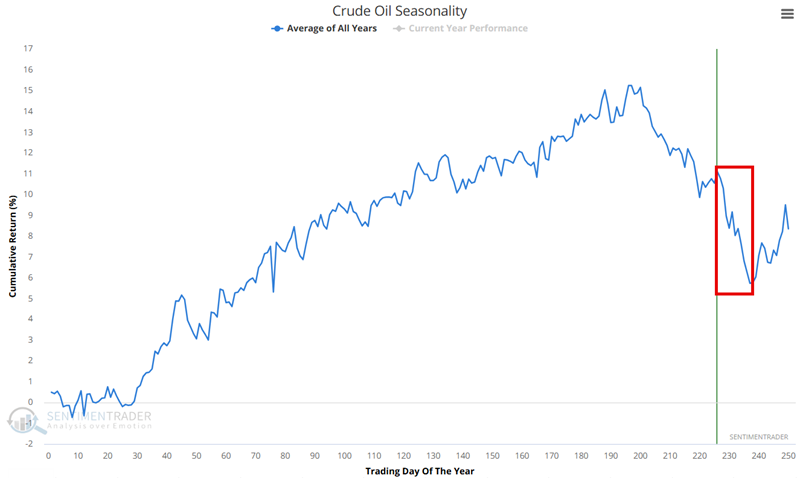
The chart below shows the Annual Seasonal Trend for crude oil futures. An unfavorable period extends from the close on Trading Day of the Year (TDY) #226 through TDY #237. For 2025, this period runs from the close on November 14th through December 1st.
The chart below displays the hypothetical cumulative $ (+/-) achieved by holding a long position in crude oil futures only during this period, since 1983. The cumulative loss equals -$84,290c
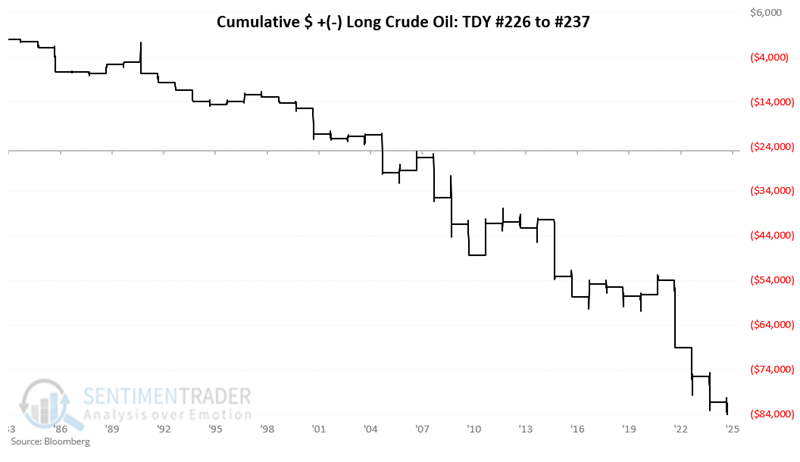
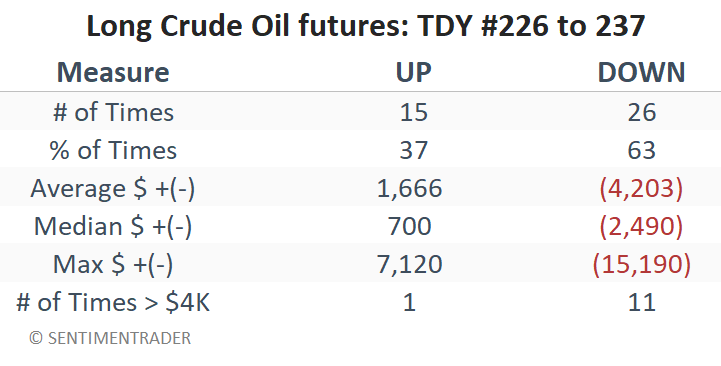
At a glance, the equity curve chart above appears to show a relentless downtrend during the second half of November. But it is crucial to understand that this is no "sure thing" and that results can vary significantly from year to year. The "Good News" is that crude oil has managed to show a gain during this period in 15 of the past 41 years, i.e., fully 37% of the time. Therefore, it is essential to understand that the message here is not that crude oil prices are destined to decline between now and December 1st. The table below summarizes the performance of crude oil during this period, starting in 1983.
So, the real messages are that:
- Crude oil tends to decline during this period (63% of the time lower)
- The declines show a strong tendency to be notably worse than the advances (Average loss 2.52 times the average gain; Median loss 3.55 times the Median gain; Period moves of $4K or more have skewed to the negative side 11-to-1
- If you are considering playing the long side, you might consider waiting until early December (or you'd better have a very good reason for taking the plunge in the near term)
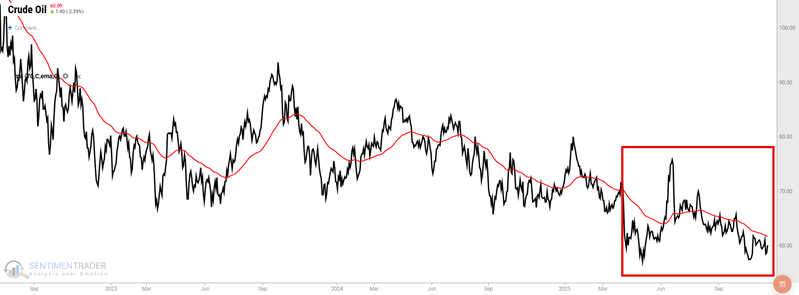
Crude oil has essentially spent the last seven months in a large trading range, and is unchanged since early April (in stark contrast to other commodities like Gold and Silver). However, it is presently trading below its 70-day exponential moving average. So, at the moment, seasonality and price action are in agreement.
Aggressive traders might consider playing the short side of crude oil futures (with a stop-loss order in place to limit risk if seasonality does not play out this year) or the United States Oil Fund LP ETF (USO). Playing options on the ticker USO is another possibility for non-futures traders seeking to play the short side of the oil market.
Could crude oil bounce higher instead between now and December 1st? Absolutely. History suggests a 37% chance of that. Nevertheless, history also suggests that a trader should have a firm conviction before committing capital to the long side of crude oil between now and the end of November.
What the research tells us…
Historically, crude oil price action clearly skews to the negative during the second half of November. As long as price action remains below its intermediate-term moving average, aggressive traders may consider playing the short side via futures or an oil ETF, such as USO. As always, seasonality is ultimately a look back at what has happened in the past, and not a roadmap of what will happen in the future. Regardless of the setup that triggers any trade, a trader is never relieved of their responsibility to a) intelligently allocate capital (i.e., never "bet the ranch"), and b) ruthlessly manage risk.