
When Bonds Don't Provide a Buffer

When stocks have been falling, bonds haven't provided much of a haven. And it's scaring some investors that held ingrained beliefs about the nature of the two assets to backstop each other.
Over the past 60 days, the correlation of daily changes between the S&P 500 and 10-year Treasury yields has turned decidedly negative. This means that on days when the S&P fell, note yields often rose, meaning bond prices declined along with stocks. When both stocks and bonds fall together, then a large part of most investors' portfolios take a hit.
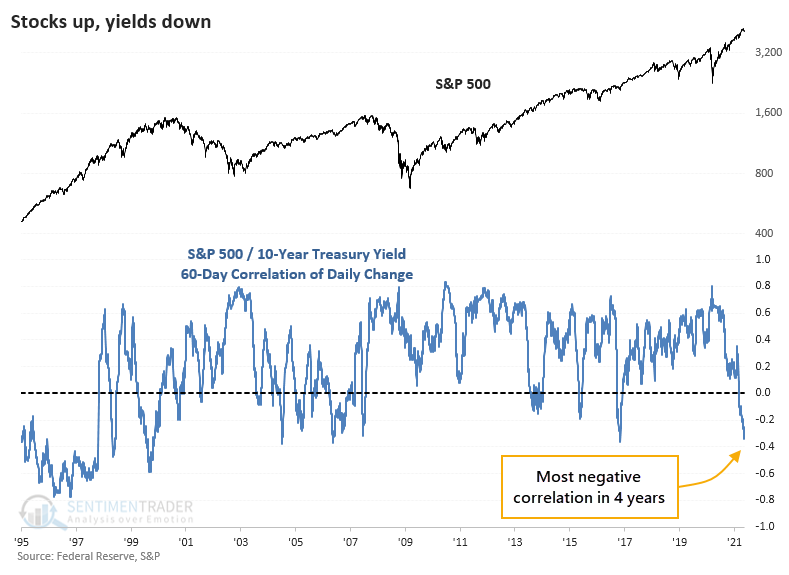
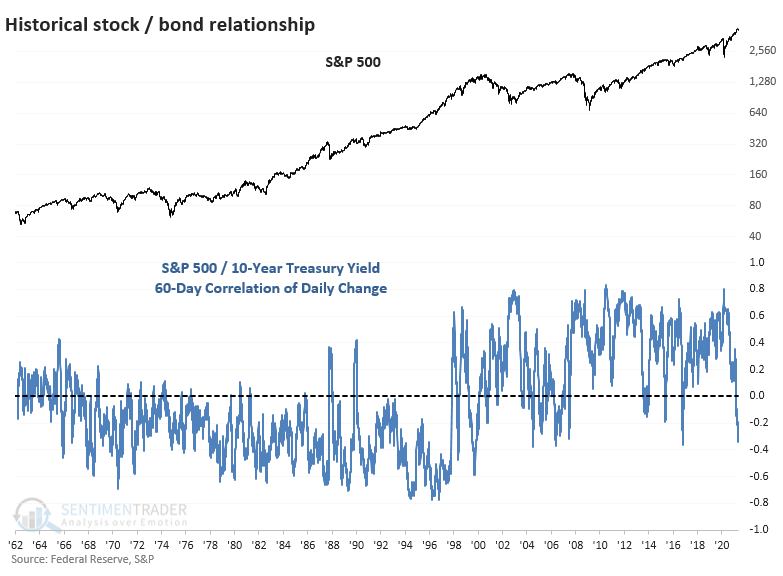
The chart above shows that the correlation is now among the most negative in 25 years. Zooming out for a longer view, we can see that a negative correlation was more the rule than the exception.
STOCKS, YIELDS BOTH STUMBLED
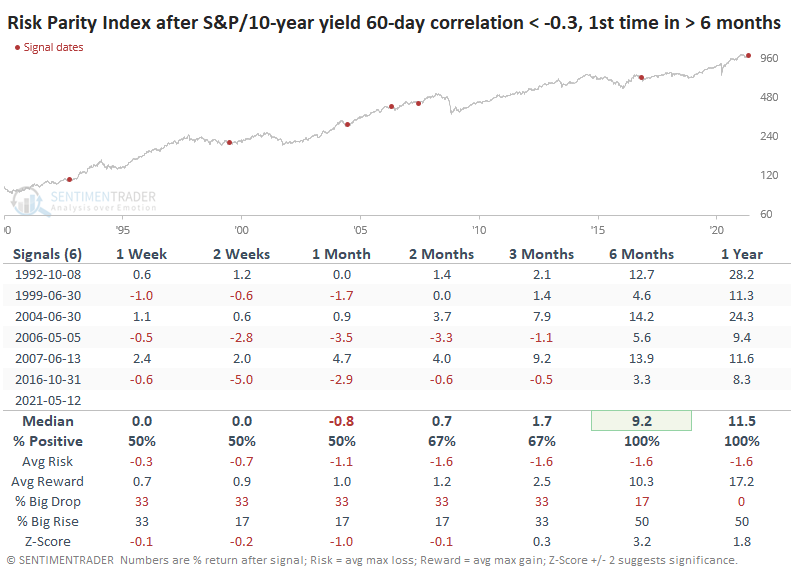
As for the implications, the table below shows future returns in the S&P 500 once the correlation between it and note yields fell to -0.3 for the 1st time in at least 6 months. This was relatively common before 1978, then didn't happen even once until 1992.
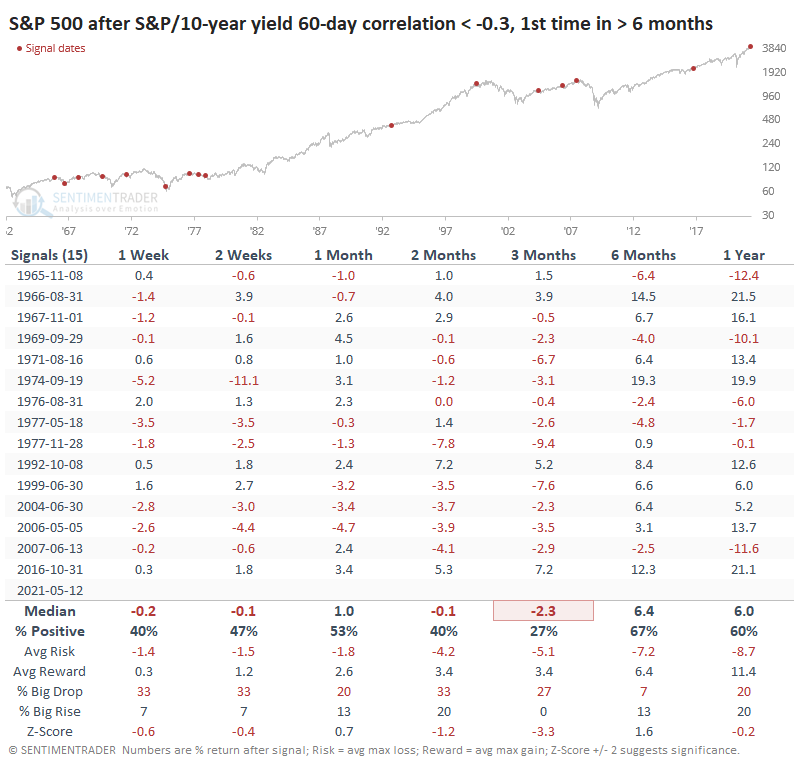
The table shows that the S&P struggled once the relationship turned this negative. Over the next 3 months, the index rose only 27% of the time, suffered a negative median return, and had risk that was well above reward. It was much more likely to show a big drop than a big rise over that time frame. See this Knowledge Base article for more details on what the terms in the table represent.
Bulls might seize on that last signal, which proved to be the biggest exception of them all. We tend to place more weight on recent occurrences, so this is a modest knock against relying too much on the negative implications.
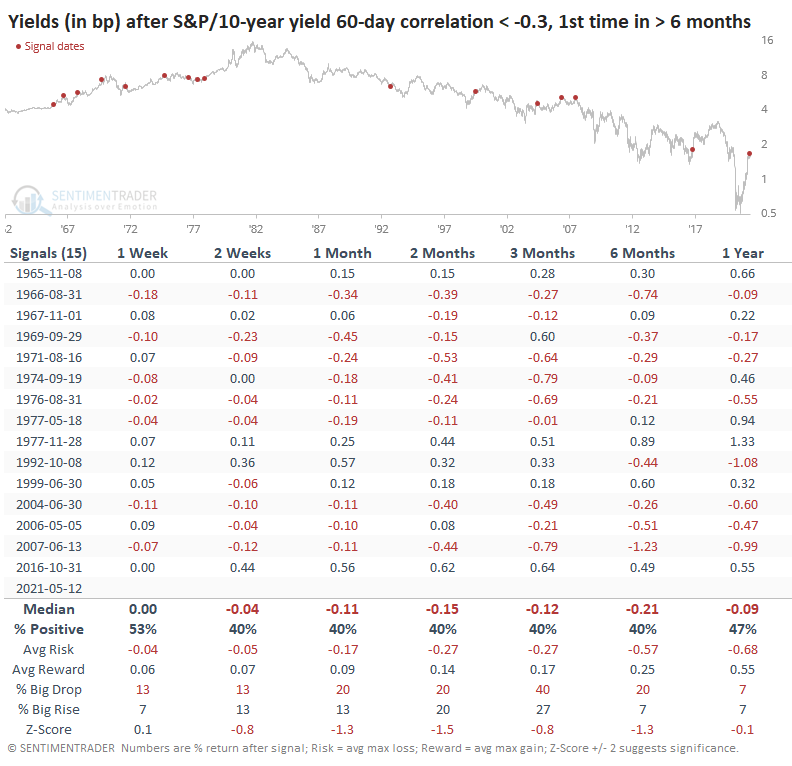
For bond yields, the path forward was mostly lower. That's not a big surprise since the trend in yields was down over much of the study period.
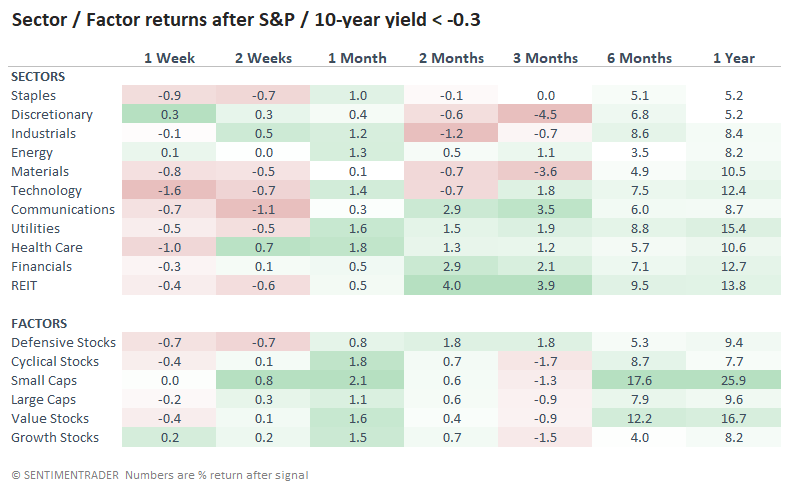
GOOD FOR FINANCIALS, BAD FOR TECH
Among sectors and factors, REITS and Financials tended to rank among the best places to be, while Discretionary and Technology stocks were among the worst.
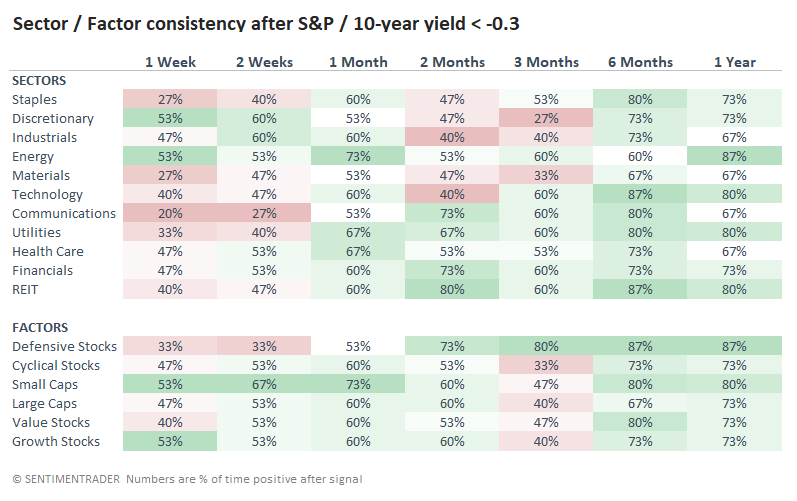
Instead of looking at median returns as the above table shows, the one below shows the percentage of time each sector and factor showed a positive return. Financials showed a positive return 60% of the time over the next 3 months, while Discretionary stocks only had a 27% win rate.
RISK PARITY SHOWED GOOD LONG-TERM RETURNS
As Bloomberg noted about this correlation between stocks and bonds:
"Bond declines tend to raise more alarm for risk-parity strategies, which typically have higher-than-average allocations to debt owing to its lower volatility. In this view, the selloff in Treasuries this year has been especially concerning because it signals investors are demanding higher yields after a decade of falling rates." - Bloomberg
When we look at an appended index of risk parity strategies from Salient and Advanced Research, medium-term returns were mixed. There were a couple of losses, a couple of gains, and a non-event. But over the next 6-12 months, risk parity rebounded every time.
Since both stocks and bond yields tended to decline over the medium-term, this deep negative correlation between stocks and yields suggests that investors would have benefited toward tilting their portfolios more toward bonds. Granted, this is relying on historical relationships, but at least it includes periods prior to the generational peak in yields in 1982.