
When Bitcoin Meets the Yield Curve

Key points
- Bitcoin's history is relatively short, so trying to draw any conclusions regarding price movement regarding any particular factor entails risk
- That said, we've found an interesting relationship between changes in the yield curve and Bitcoin price performance
- It seems that Bitcoin performs much better when the spread between 2-year and 10-year treasuries falls - but there's a twist
A closer look at the 2-Year / 10-Year Yield Curve
It's challenging to understand precisely what drives Bitcoin. While Bitcoin is ostensibly a form of currency, there is a relationship between its price movements and the action in interest rates. We will test one iteration of this relationship.
For our interest rate measure, we will use the spread between the yield on two-year treasury notes and the yield on the 10-year treasury note (heretofore referred to as the "2/10 spread")
The chart below displays the history of the 2/10 spread since 2008. Note that Bitcoin started trading in 2010.
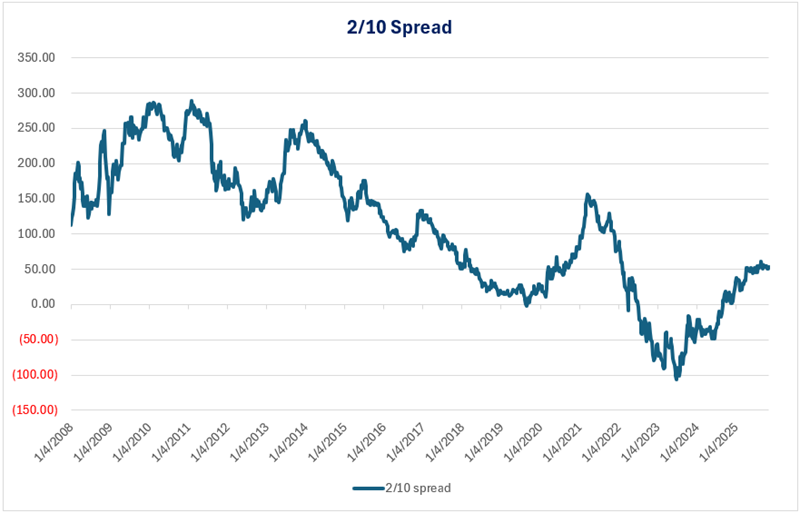
The 2/10 spread is recorded in "basis points" and is calculated as follows:
2/10 Spread = (Yield on 10yr. note - yield on 2yr. note) x 100
So, for example, if the yield on a 10-year note was 4.10% and the yield on a 2-year note was 3.55%, the 2/10 spread would be reported as:
(4.10 - 3.55) x 100 = 55.00
The 2/10 spread is normally a positive number, but can at times go negative if the 2-year yield rises above the 10-year yield.
So here is our test:
- At the end of each week, we will note the spread between the yield on 2-year treasury notes and 10-year treasury notes (for the week ending November 7th, the 2/10 spread value was 53.29)
- Next, we push the latest weekly 2/10 spread out two years, or to be more precise, 104 weeks (So the 2025-11-07 value of 53.29 gets pushed out to 2027-11-05)
- From here, we will attempt to identify potential turning points in Bitcoin price action by visually identifying peaks and troughs in the data series that has been pushed 104 weeks into the future
Sound a little convoluted? Perhaps. But let's run the test and consider the hypothetical results to see if there might be something here.
Bitcoin versus the 2/10 year spread
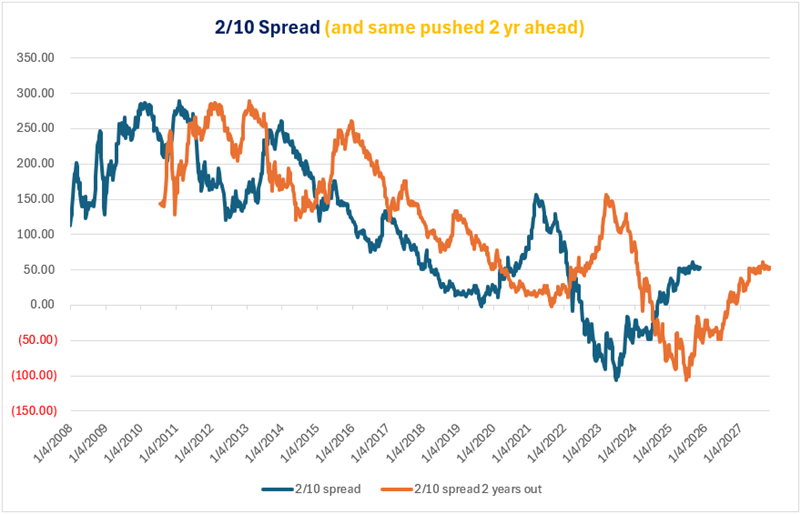
The chart below shows two lines:
- Blue line = The 2/10 spread at the end of each week since January 2008
- Other line = The same data series (end of week 2/10 spread) pushed two years into the future
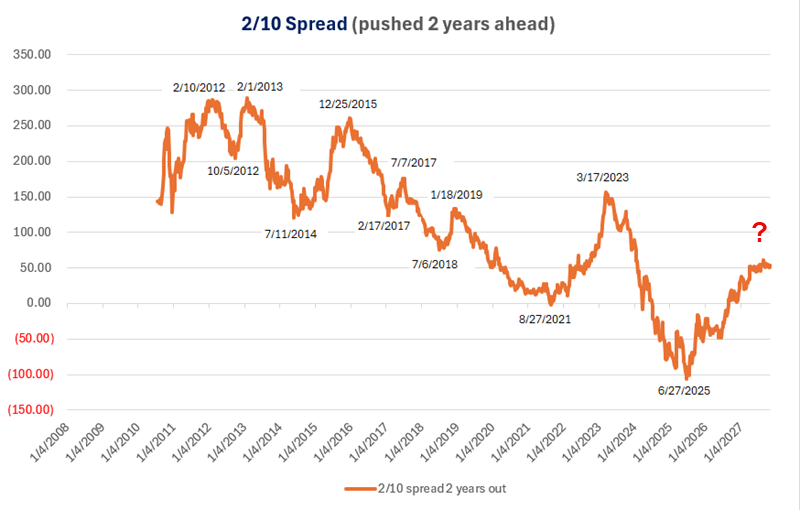
In the chart below, we examine the 2/10 spread pushed two years into the future and label the dates of the prominent peaks and troughs. Eventually, we will treat the labeled peaks as the beginning of a favorable period for Bitcoin and the labeled troughs as the end of a favorable period for Bitcoin. Note that the most recent trough occurred on June 27th, 2025, and that there is no prominent subsequent peak after that so far.
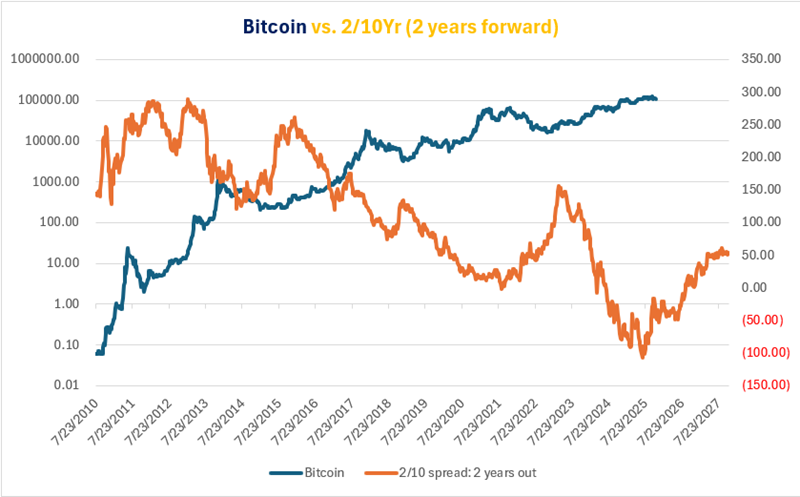
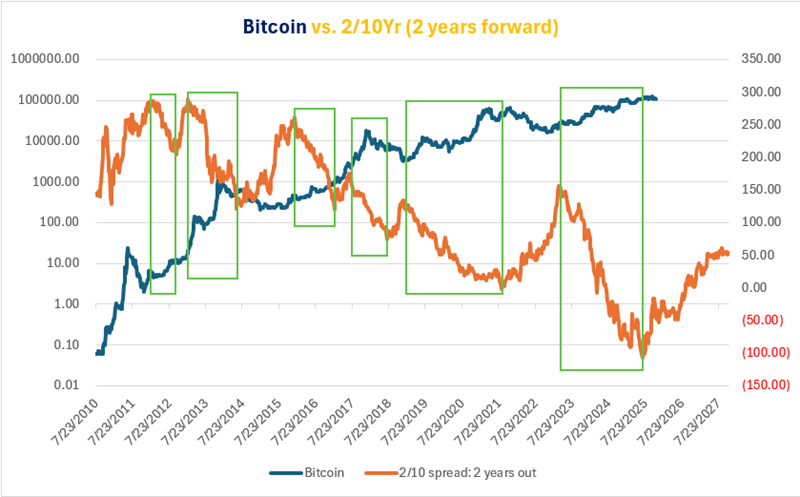
Now, let's combine Bitcoin and the 2/10 spread (pushed two years forward) onto one chart to observe the relationship. The orange line in the chart below displays the 2/10 spread pushed two years forward. The blue line is the price of Bitcoin (drawn on a logarithmic scale).
A closer look at Favorable periods
We will arbitrarily begin this test on January 1st, 2012. The chart below highlights in green boxes the favorable periods for Bitcoin (i.e., the periods between the peaks and troughs for the 2/10 spread, pushed two years forward, as identified above).
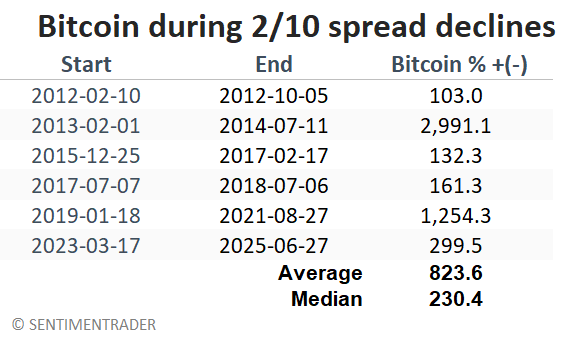
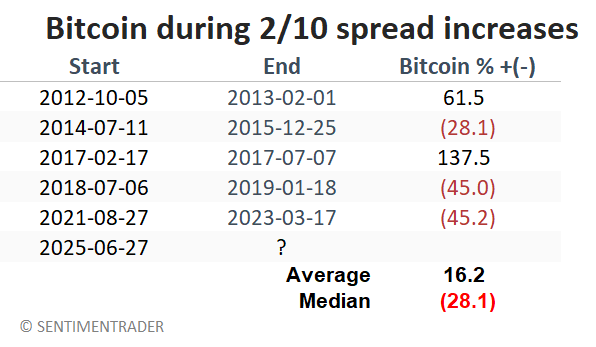
The table below displays Bitcoin performance during the favorable periods highlighted in the chart above.
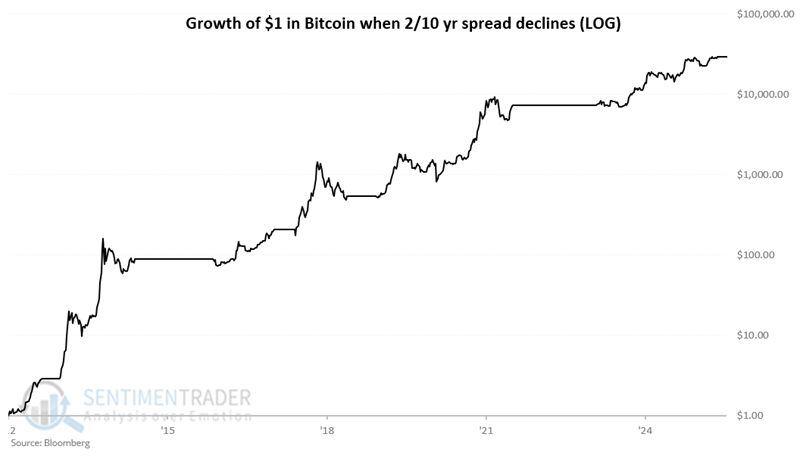
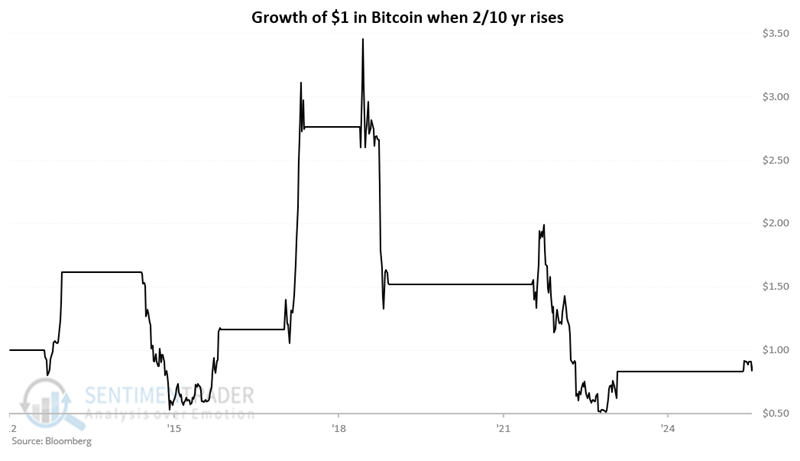
The chart below displays the hypothetical growth of $1 invested in Bitcoin only during the favorable periods highlighted above. The hypothetical gain from February 17, 2012, through November 7, 2025, is 2,920,650.4%.
Now, let's examine all other periods starting in 2012.
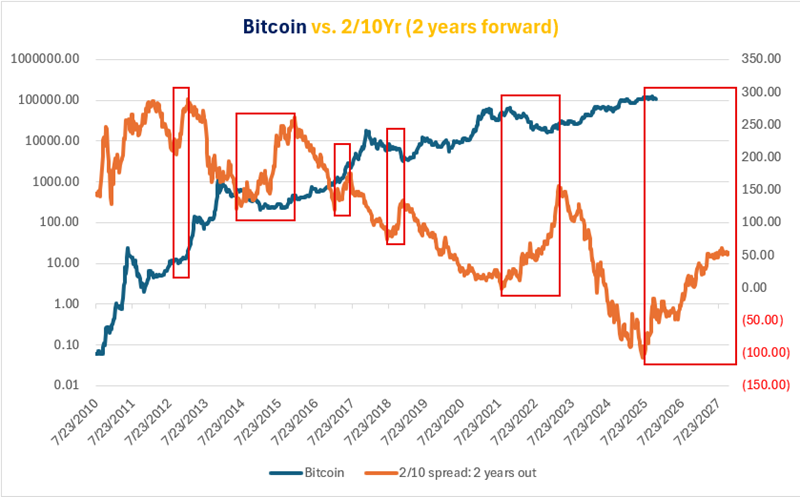
A closer look at Unfavorable periods
The chart below highlights, in red boxes, the unfavorable periods for Bitcoin (i.e., the periods between the troughs and peaks for the 2/10 spread, which have been pushed forward two years).
The table below displays Bitcoin performance during the unfavorable periods highlighted in the chart above.
The chart below displays the hypothetical growth of $1 invested in Bitcoin only during the unfavorable periods highlighted above. The hypothetical return from February 17, 2012, is -19.4%.
While the results during unfavorable periods are not disastrous and do contain several significant advances, the primary point is the massive difference in Bitcoin's performance between favorable and unfavorable periods.
What the research tells us…
There appears to be a meaningful relationship between Bitcoin price movements and changes in the 2/10 spread. Whether actual causation is involved is a debatable question, so basing one's Bitcoin buy and sell decisions solely on this relationship is extremely risky. That said, as a proud graduate of "The School of Whatever Works", I find the results compelling and will continue to keep track of them.
The 2/10 spread bottomed at -106.30 on June 30, 2023. This ostensibly triggered a sell signal from the model detailed above, 104 weeks later, on June 27, 2025. So far, there is no clear peak in the 2/10 spread, which has been pushed out two years. So does this mean that Bitcoin is doomed to fall in value over the next two years? Not at all. However, the results shown above suggest that Bitcoin's performance may be subpar over the next two years. Buttressing this possibility are the implications of the 4-year cycle detailed in this note from October 22nd.