Products
SentimenTrader Trading Tools
‍
Backtest Engine
My Trading Toolkit
Correlation Analysis
Seasonality
Market Prediction
Indicators & Data API
‍
Proprietary Indicators & Charts
Market Data API
Strategies & Scanner
‍
50+ Trading Strategies
Smart Stock Scanner
Smart Option Scanner
Research Reports
‍
Research Solutions
Reports Library
Free Resources
Simple Backtest Calculator
Simple Seasonality Calculator
The Kelly Criterion Calculator
Sentiment Geo Map
Public Research Reports
Education
Sentiment Indicators
Technical Indicators
Pricing
Company
About
In the News
Testimonials
Client Success Stories
Contact
Log inLoginSign up
< BACK TO ALL REPORTS

What's the market message from the surge in crude oil

Dean Christians
2022-03-04
The surge in crude oil triggered a signal that suggests slightly negative to flat returns for stocks and potentially slower economic growth. Let's review the historical record after similar instances.

Key points:

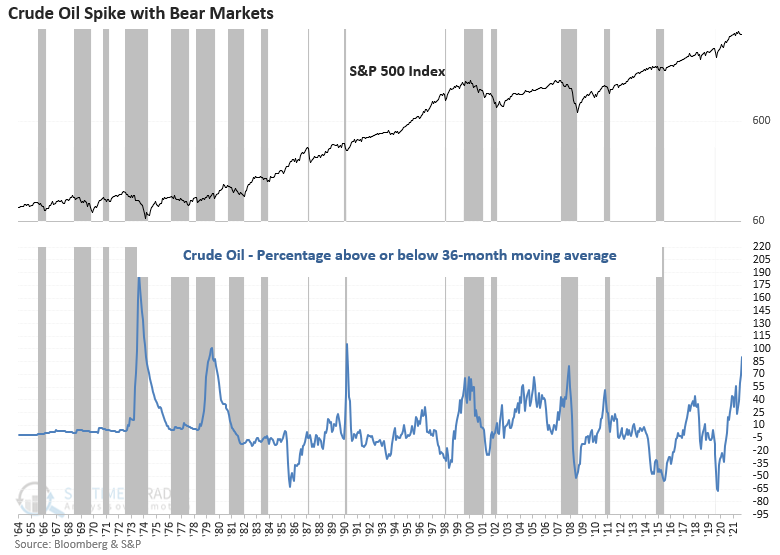
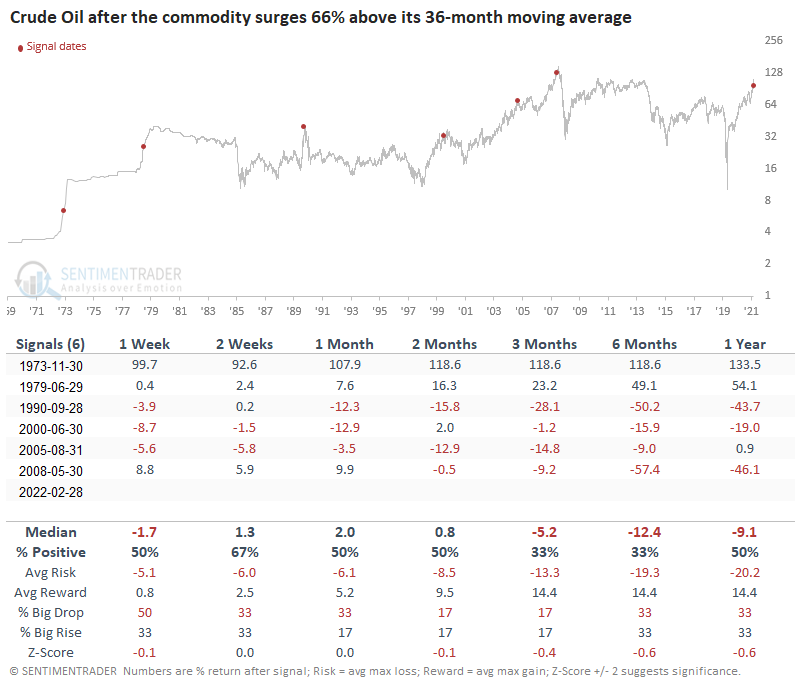
  • Crude oil has surged 68% above its 36-month moving average as of 2/28/22
  • Similar spikes suggest stocks could struggle
  • We should also be more attentive to slowing economic conditions

Does a surge in crude oil provide a market message

Crude oil and other commodities have been in solid uptrends for some time now. The Russia/Ukraine conflict has impacted near-term price action, causing massive spikes in several markets like energy, metals, and grains. As of 2/28/22, crude oil traded 68% above its 36-month moving average. If we look at the intra-month spread above the average, my data shows 90% as of 3/3/22.

I conducted an optimization process with monthly data, which has more history, to identify what level above the 36-month moving average impacted stocks. The study showed a cross above 66% as the level at which the S&P 500 struggled the most. Let's review the outlook for stocks after similar surges in crude oil.

Several surges in crude oil have coincided with bear market periods for stocks.

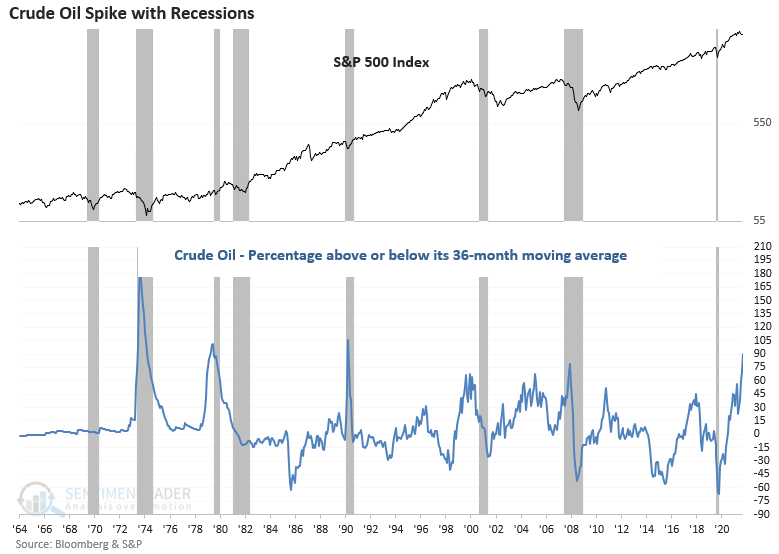
Similar surges in crude oil impacts the economy

Massive spikes in crude oil have typically preceded recessions since 1973. As a reminder, one should always use a weight-of-the-evidence approach versus relying upon a single indicator.

Similar signals show slightly weak to flat results

This signal triggered 6 other times over the past 49 years. After the others, S&P 500 future returns, win rates, and risk/reward profiles were underwhelming across all time frames. Stocks traded lower at some point in the first three months in all instances. While the sample size is small, there are some noteworthy signals. 

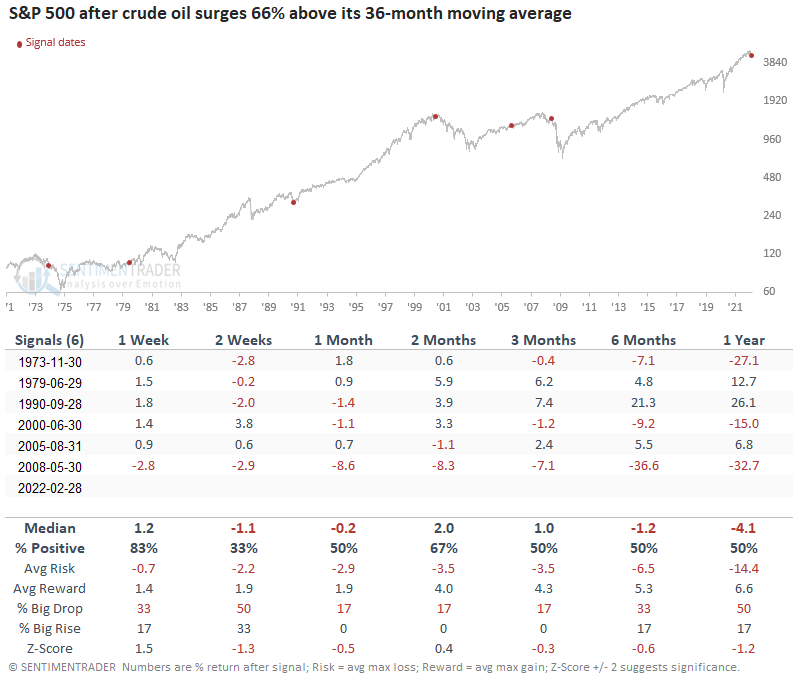
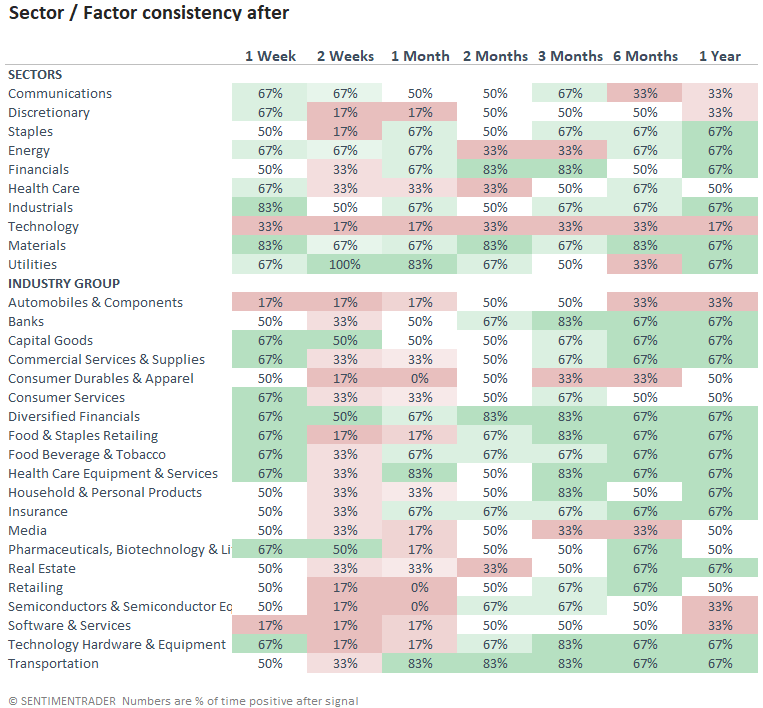
Sectors and industry group performance

Sector and industry group returns reflect the same underwhelming message as the S&P, with some notable standouts. In particular, the technology sector shows very weak performance trends across all time frames. Value-oriented sectors performed better than growth ones.

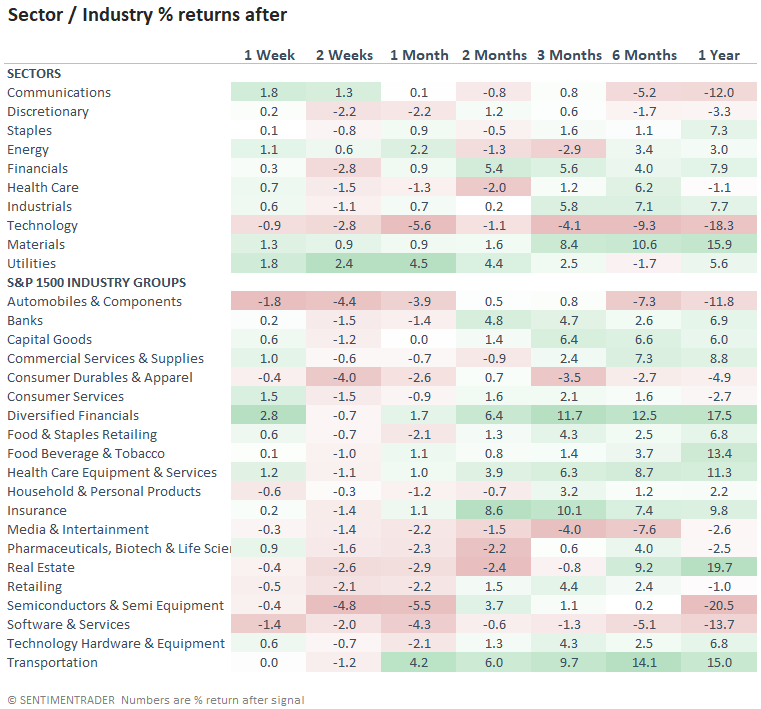
The consistency table highlights the same general trends. Value-oriented groups look much better than growth ones.

Crude shows weak performance trends

The spike in crude oil would suggest that we need to be mindful that prices could reverse lower, especially if the Russia/Ukraine situation ends abruptly. I would ignore the returns from the 1973 signal as it reflects monthly data, whereas the other signals use daily. i.e., it's a data constraint.

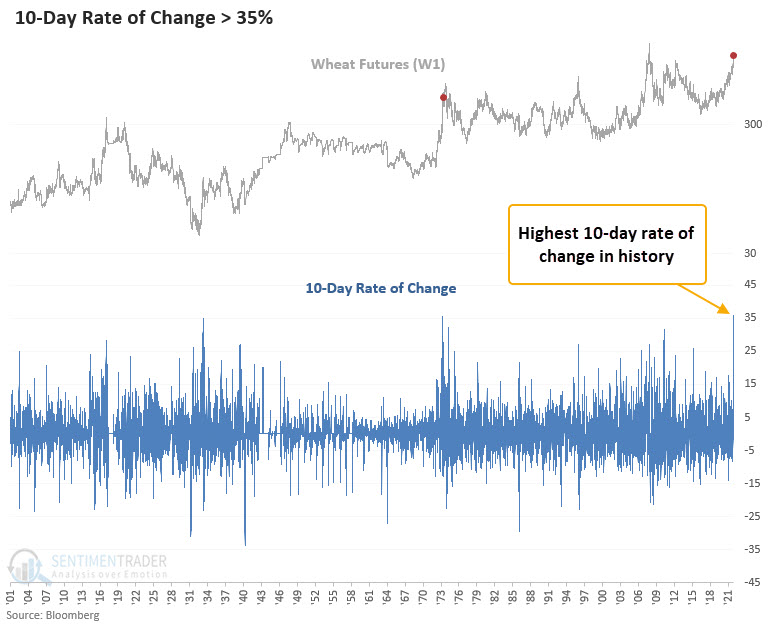
A bonus chart - Wheat futures reflect the near-term panic bid in certain commodities

Russia and Ukraine are responsible for a sizable chunk of global wheat production. The conflict is wreaking havoc on wheat prices and other grains, adding one more tax on consumers, ultimately impacting global economies.

What the research tells us...

When crude oil surges by a significant amount above its 36-month moving average, history suggests that stocks could struggle and that we need to be more alert to an economic slowdown. Similar signals to what we're seeing now have preceded slightly weak to flat returns for the S&P 500 across short and medium-term time frames. An assessment of sectors and industries shows a more favorable outcome for value-oriented groups. If the Russia/Ukraine conflict ends abruptly, crude could see a sharp reversal lower.

PRODUCTS
SentimenTrader
Trading Tools
Indicators & Data API
‍
Strategies & Scanner
‍
Research Reports
FREE
RESOUrCES
Simple Backtest
Calculator
Simple Seasonality
Calculator
The Kelly Criterion
Calculator
Sentiment Geo Map
‍
Public Research Reports
‍
Education
Sentiment Indicators
‍
Technical Indicators
‍
Pricing
Bundle pricing
‍
FAQ
‍
Announcements
‍
COMPANY
‍
About
‍
In the News
‍
Testimonials
‍
Client Success Stories
CONTACT
‍
General Inquiries
‍
Media Inquiries
‍
Financial Professionals Inquiries
‍
© 2026 Sundial Capital Research Inc. All rights reserved.
Setsail Marketing
TermsPrivacyAffiliate Program
Risk Disclosure: The information and tools provided are for research and analytical purposes only and are not intended as investment advice. Market analysis involves uncertainty, and outcomes may differ from expectations. Users should conduct their own due diligence and consider their individual circumstances before making any financial decisions. Past performance is not necessarily indicative of future results.

Hypothetical Performance Disclosure: Hypothetical performance results have many inherent limitations, some of which are described below. No representation is being made that any account will or is likely to achieve profits or losses similar to those shown; in fact, there are frequently sharp differences between hypothetical performance results and the actual results subsequently achieved by any particular trading program. One of the limitations of hypothetical performance results is that they are generally prepared with the benefit of hindsight. In addition, hypothetical trading does not involve financial risk, and no hypothetical trading record can completely account for the impact of financial risk of actual trading. for example, the ability to withstand losses or to adhere to a particular trading program in spite of trading losses are material points which can also adversely affect actual trading results. There are numerous other factors related to the markets in general or to the implementation of any specific trading program which cannot be fully accounted for in the preparation of hypothetical performance results and all which can adversely affect trading results.

Testimonial Disclosure: Testimonials appearing on this website may not be representative of other clients or customers and is not a guarantee of future performance or success.