
What's the market message from the deteriorating housing market

Key points:
- Single-family new home sales for April declined on a month/month basis by over 16%
- With the most recent data, sales have now contracted for 4 consecutive months
- The year/year change for new home sales has now fallen by over 26%
- After similar sales trends, homebuilders show negative returns
Single-family new home sales are feeling the impact of higher rates and home values
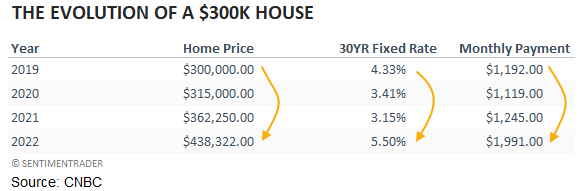
Increasing mortgage rates and home values are impacting new home sales in a meaningful way. According to a study from CNBC, the monthly payment for a new home in 2022 is now $800 more than in 2019. I would also note that the change does not include insurance or taxes.
Let's assess the outlook for stocks and economic activity when new home sales attain the following conditions.
- Single-family new home sales declined for 4 consecutive months
- The year/year change for single-family new home sales decreased by 25%
I will use a reset condition for both studies to screen out repeat signals.
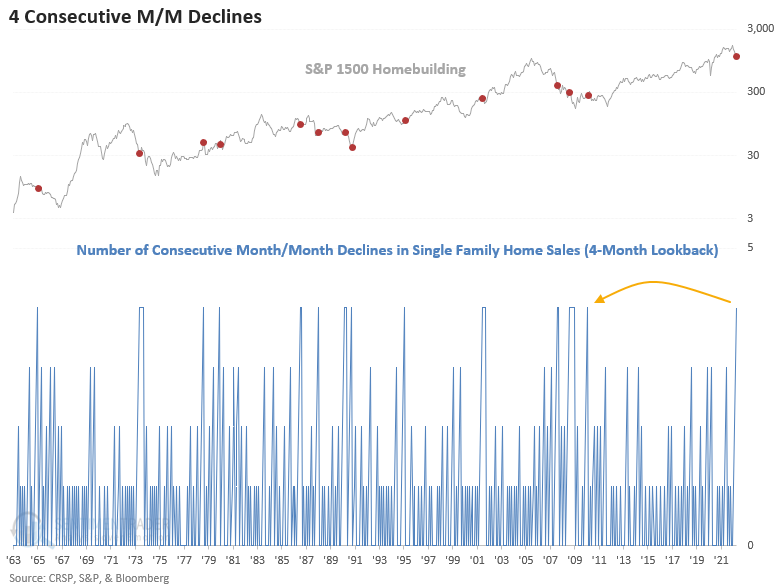
For the first time since 2010, new home sales have fallen for 4 consecutive months.
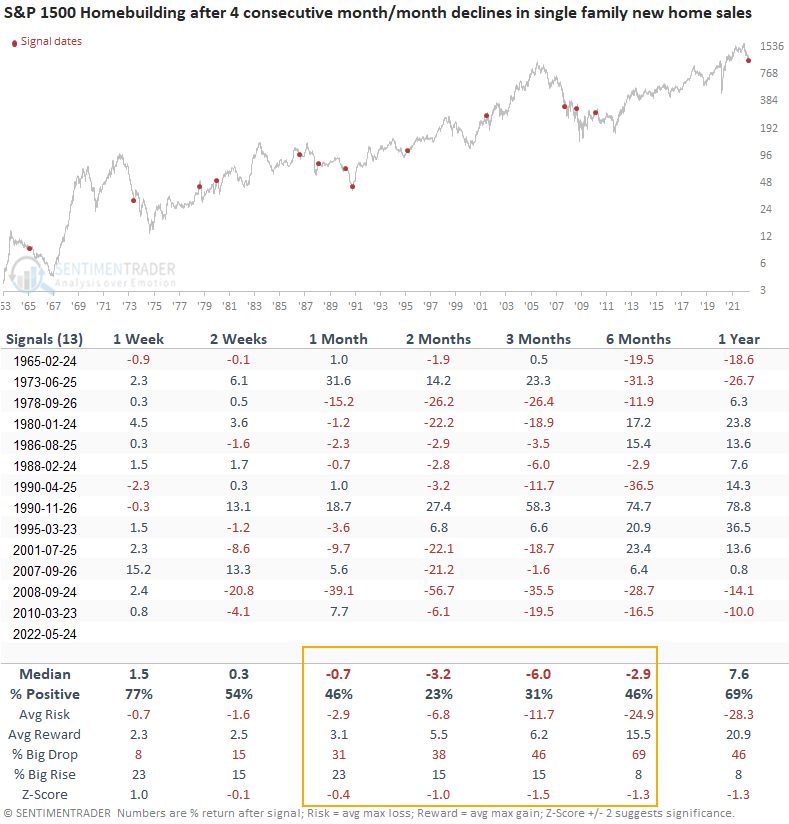
Similar signals preceded negative returns for homebuilding stocks
This study generated a signal 13 other times over the past 58 years. After the others, homebuilding stocks look unfavorable on a medium-term basis, especially in the 2 & 3-month windows. The second signal in 1990 is the only instance that marked an almost immediate low. However, I would note that the Federal Reserve had lowered interest rates 8 times before the signal.
I adjusted the signal dates to reflect the 17th business day of each month. i.e., the release day.
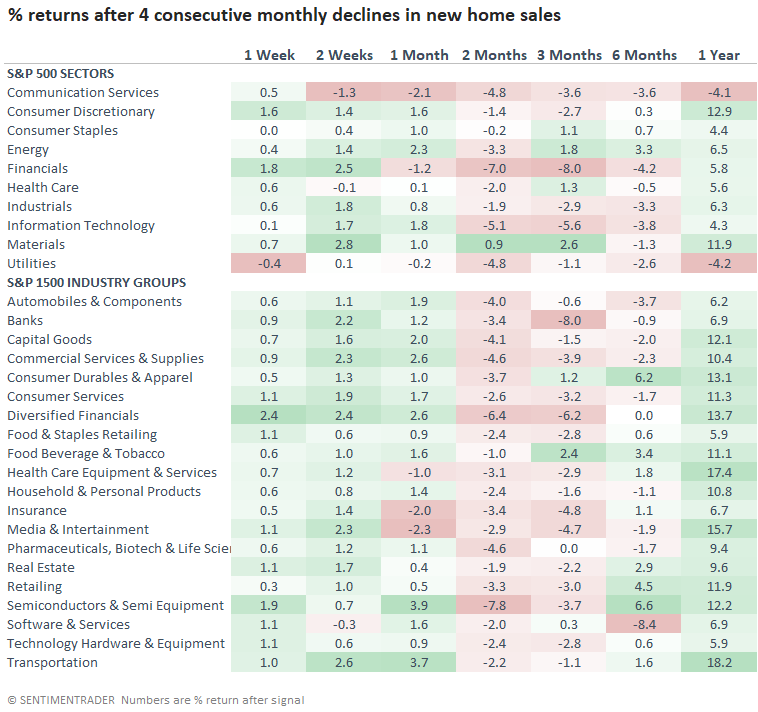
Sectors and industry group performance after signals
The sector and industry group table shows a similar return outlook to the homebuilding group. Medium-term results look unfavorable. I suspect the weak returns for financials/banks reflect a slowing economic backdrop.
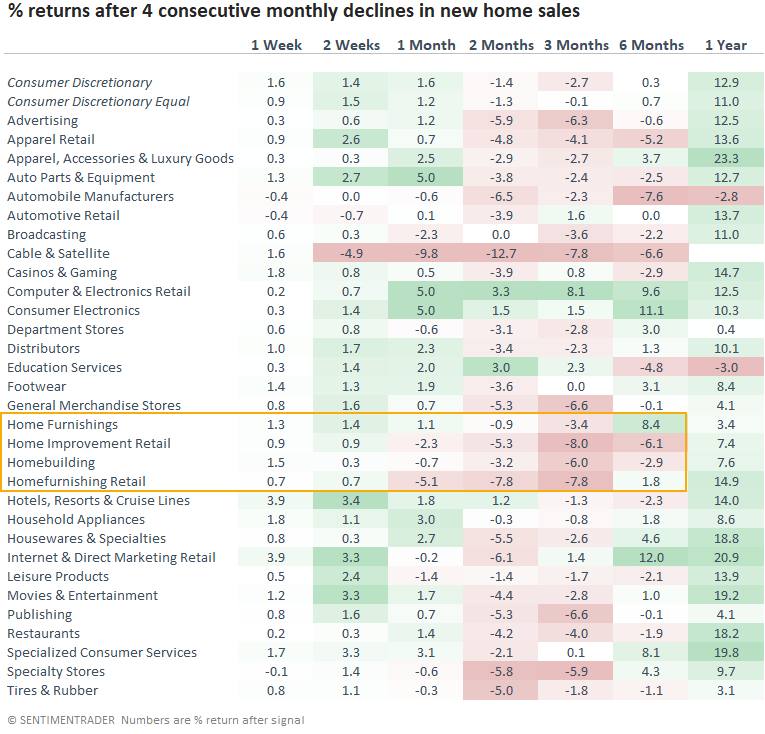
Consumer discretionary sub-industry group performance after signals
Not surprisingly, groups within the housing ecosystem show some of the weakest performance trends when new home sales deteriorate similarly to the current environment.
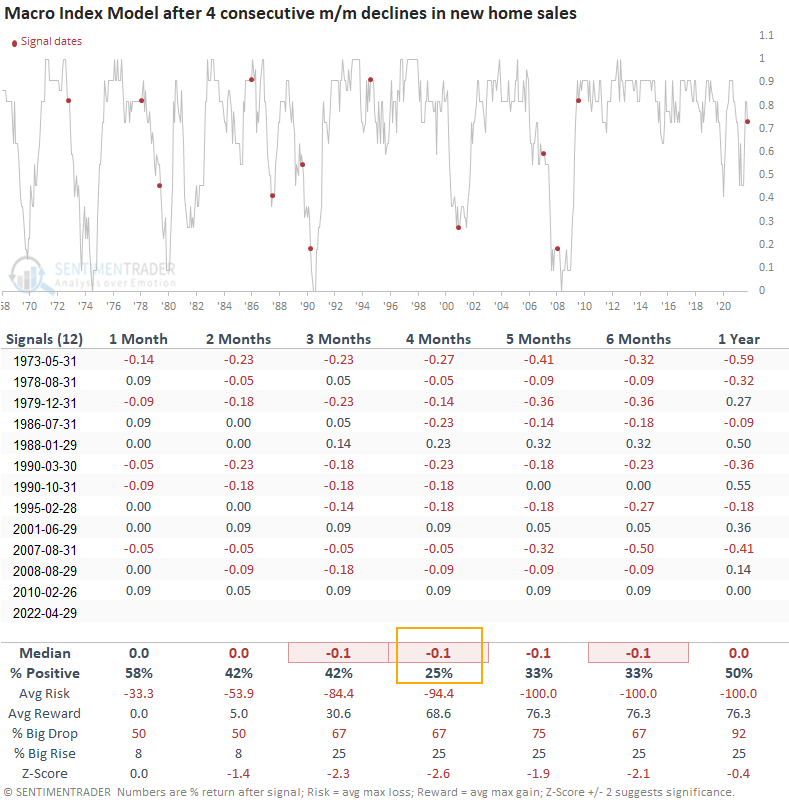
What happens to the Macro Index Model after signals
Applying the new home sales signal dates to the SentimenTrader Macro Index Model suggests the index will likely fall below the favorable 70% level in the coming months. i.e., the SentimenTrader measure of broad economic activity could deteriorate from here.
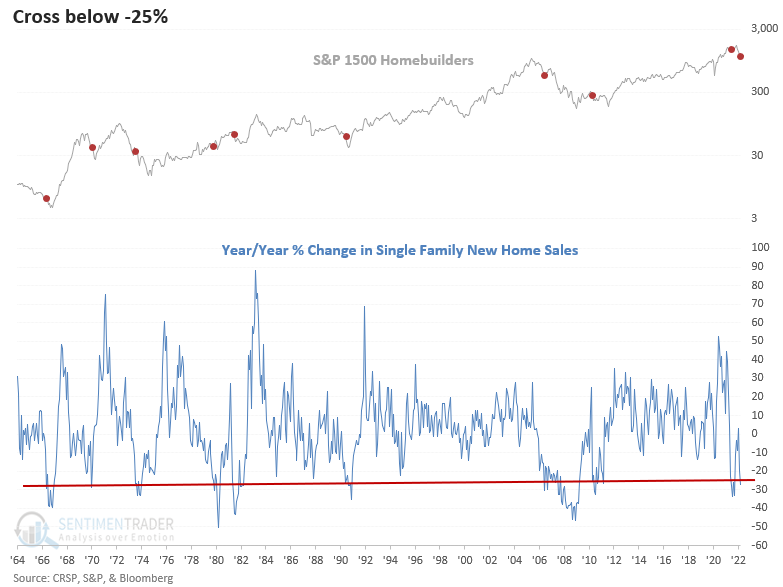
The year/year change in single-family new home sales crossed below -25% for only the 10th time in the last 56 years.
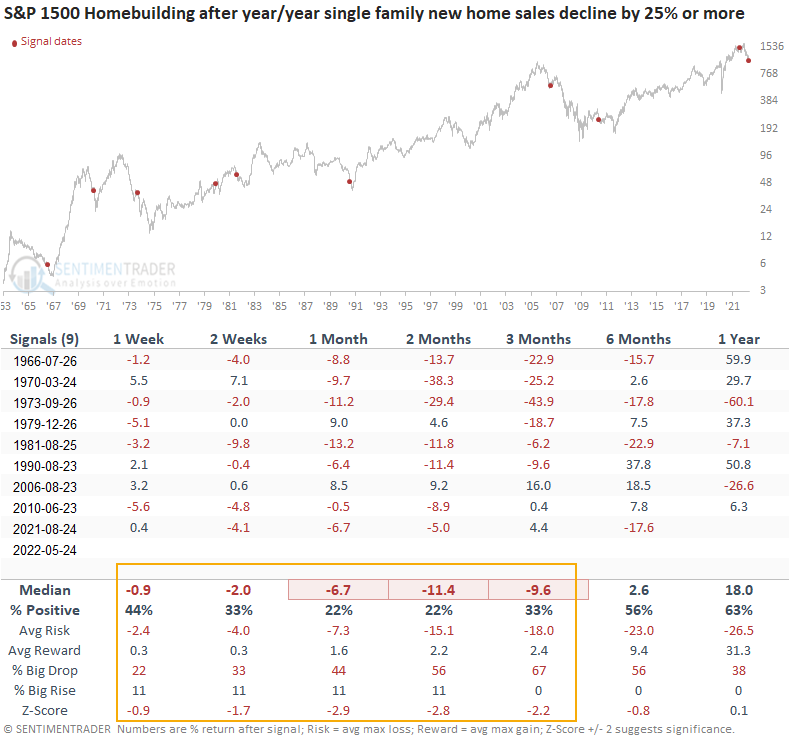
Similar signals preceded negative returns for homebuilding stocks
This study generated a signal 9 other times over the past 56 years. After the others, homebuilding stocks future returns, win rates, and z-scores look unfavorable on a short and medium-term basis, especially in the 1-3-month time frames. The y/y decline in sales shows a negative return at some point in time in all 9 instances in the first year.
I adjusted the signal dates to reflect the 17th business day of each month. i.e., the release day.
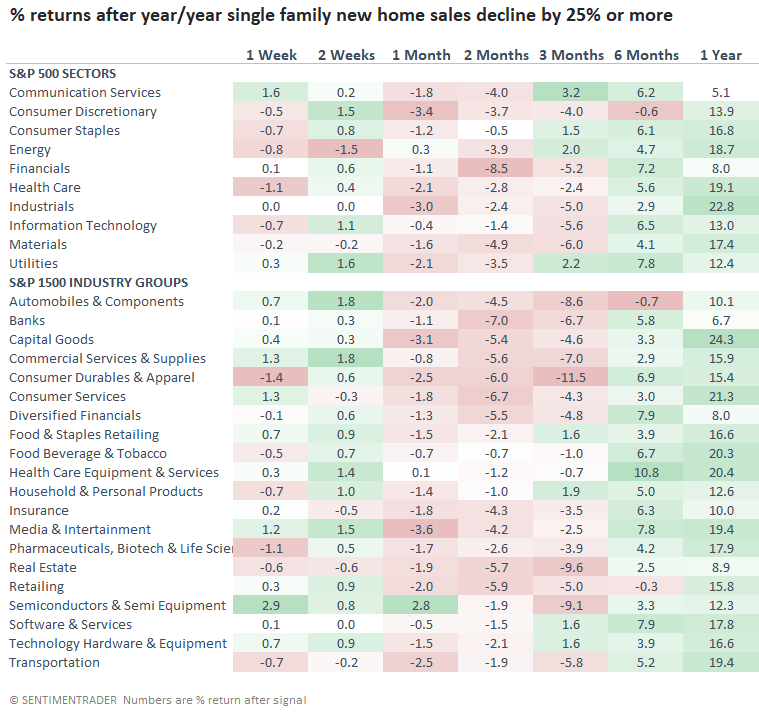
Sectors and industry group performance after signals
The sector and industry group table shows weak returns across short to medium-term time frames. Once again, the deterioration in new home sales impacts the financials/banks the most. The 6 & 12-month returns look favorable.
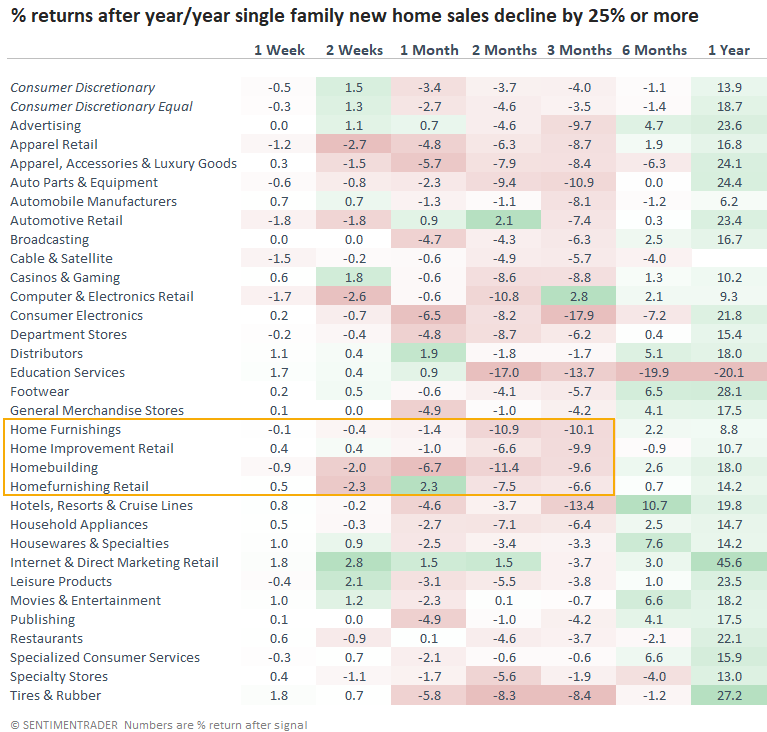
Consumer discretionary sub-industry group performance after signals
The consumer discretionary outlook table shows weak performance trends across almost all groups on a short to medium-term basis. While the 12-month returns look favorable, the 6-month window does not look as good as the sector and industry outlook. i.e., the discretionary sector could lag other groups for a bit longer.
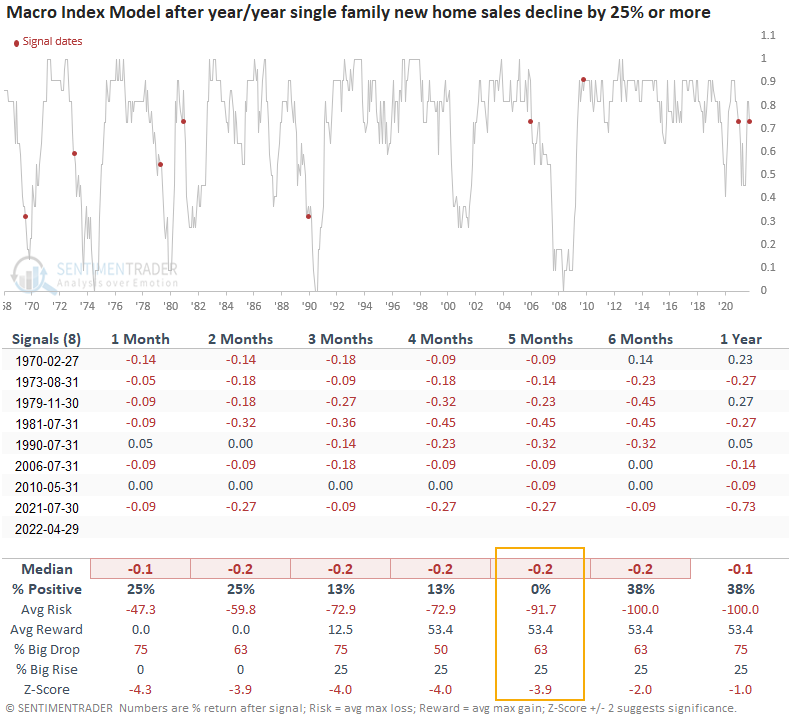
What happens to the Macro Index Model after signals
Applying the new home sales signal dates to the SentimenTrader Macro Index Model suggests the index will likely fall below the favorable 70% level in the coming months. The 5-month window shows the index declined in all 8 prior instances.
What the research tells us...
When single-family new home sales contract for 4 consecutive months or year/year sales shows a significant decline, all is not well with the housing market. Similar setups to what we're seeing now have preceded negative returns for homebuilding stocks across most time frames. When I apply the signal dates to sectors and industries, history suggests we should avoid most consumer discretionary groups and financials/banks. The poor performance from financials/banks reflects a softening in economic activity, which we see when I apply the signals to the Macro Model Index.
From a general overall market perspective, a new narrative is starting to build. The pace of more unfavorable economic data has picked up. I'm now seeing more and more comments about a potential pause from the Fed. So, we could find ourselves in an environment where poor economic data is friendly for stocks. That will make the market even more challenging.