Products
SentimenTrader Trading Tools
‍
Backtest Engine
My Trading Toolkit
Correlation Analysis
Seasonality
Market Prediction
Indicators & Data API
‍
Proprietary Indicators & Charts
Market Data API
Strategies & Scanner
‍
50+ Trading Strategies
Smart Stock Scanner
Smart Option Scanner
Research Reports
‍
Research Solutions
Reports Library
Free Resources
Simple Backtest Calculator
Simple Seasonality Calculator
The Kelly Criterion Calculator
Sentiment Geo Map
Public Research Reports
Education
Sentiment Indicators
Technical Indicators
Pricing
Company
About
In the News
Testimonials
Client Success Stories
Contact
Log inLoginSign up
< BACK TO ALL REPORTS

What you need to know about the year-end rally

Jay Kaeppel
2024-11-21
The stock market is soon entering the purported "year-end rally" period. What should investors expect? To answer that question, we analyze some market history.

Key points

  • The fourth quarter tends to be favorable for the stock market
  • Specific periods within the fourth quarter have shown to be pretty consistent
  • One such period includes the pre-Thanksgiving to early New Year period

Defining the period

The period we will consider here:

  • Starts at the close of the Monday before Thanksgiving
  • Ends at the close of the third trading day of the following year

For 2024-25, this period extends from the close on 2024-11-25 through 2025-01-06.

Measuring historical results

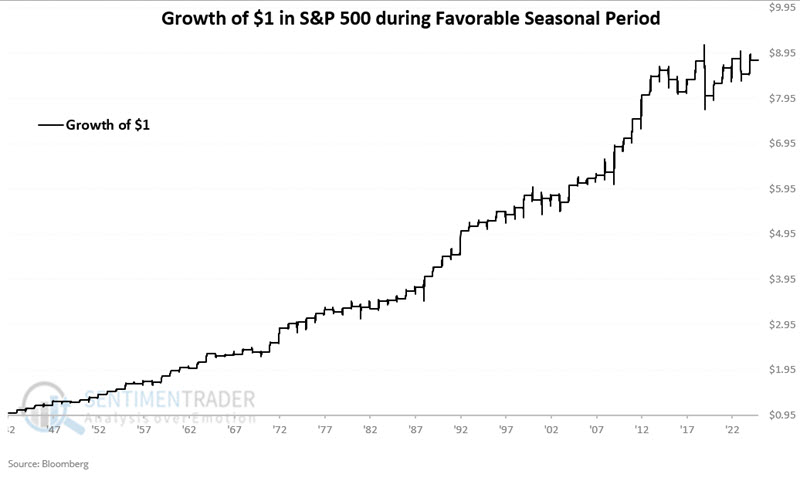
The chart below displays the hypothetical growth of $1 invested in the S&P 500 Index only during this period every year starting in 1942.

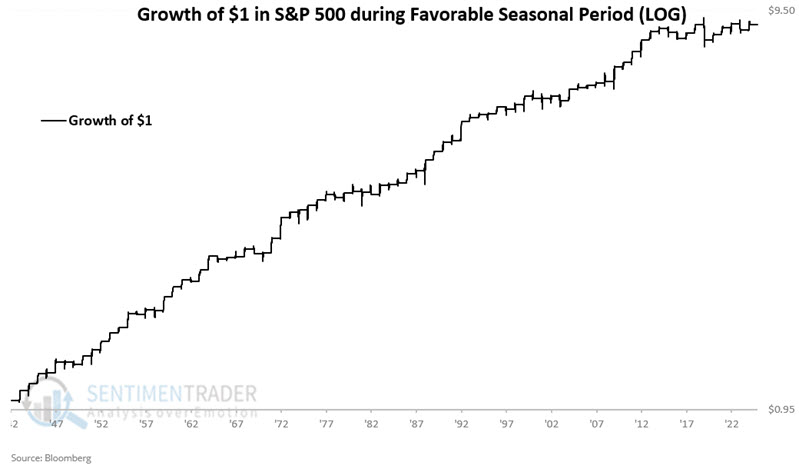
The chart below displays the same results on a logarithmic scale.

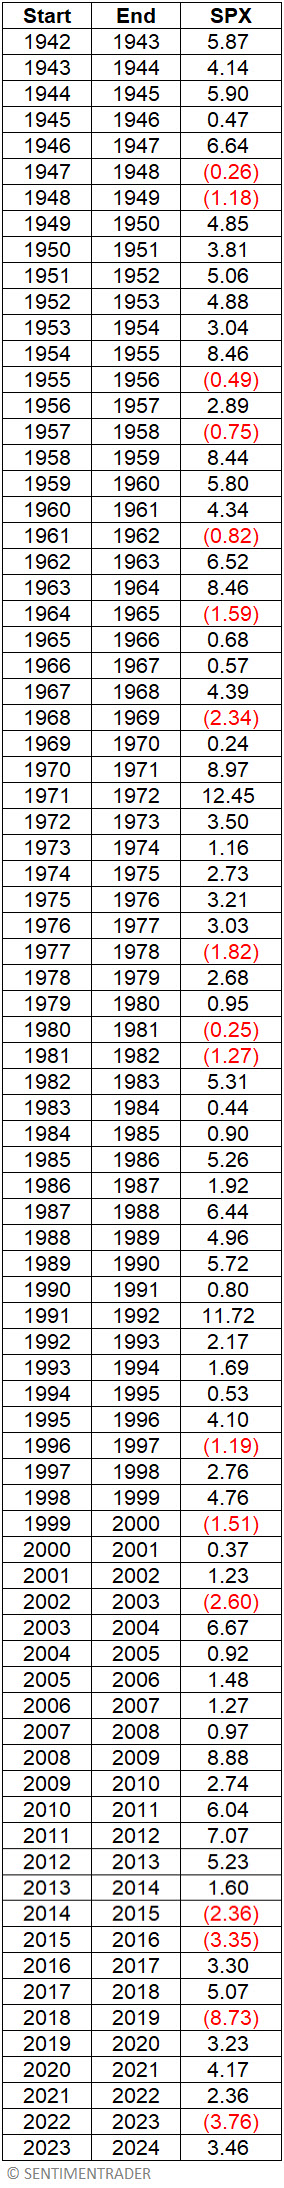
The table below displays year-by-year results.

The table below summarizes S&P 500 performance during this nine-trading day period. 

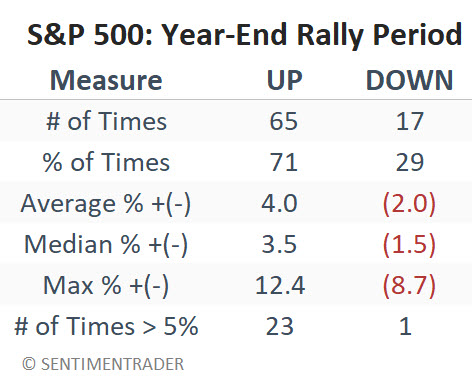
The positives are several. A 71% win rate and a median gain of 3.5% versus a median loss of -1.5% suggests a reasonable "edge." Note also that 5% or more moves skew a lopsided 23-to-1 to the positive side.

One word of caution

The good news is that the S&P 500 has tended to perform well during the year-end rally period. Also comforting is the lack of large losses. The 2018-2019 period showed a sizeable loss of -8.7%. The second worst performing period was 2022-2023, but the loss was a manageable -3.8%. There is a concern worth mentioning. No seasonal pattern is guaranteed to last forever. The chart below displays the 10-year rolling return for the year-end rally period detailed above. 

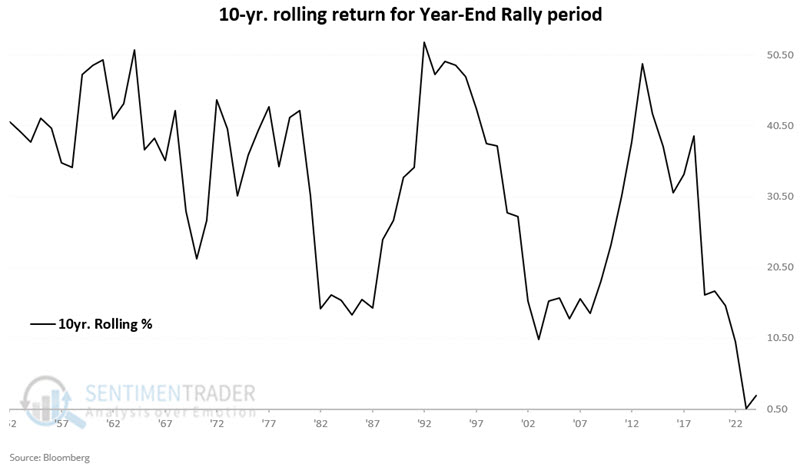
This seasonal pattern has not been nearly as effective in the last ten years as it was previously. So, has it lost its usefulness? Or is it about to re-emerge as a useful pattern? The reality is that this can only be known in hindsight. For now - particularly given the strength of the market this year - it seems reasonable to give the year-end rally the benefit of the doubt.

What the research tells us…

The good news is that the S&P 500 has tended to perform well during the late November/early January period. The bad news is that there is no guarantee that things will follow suit in 2024-2025.

PRODUCTS
SentimenTrader
Trading Tools
Indicators & Data API
‍
Strategies & Scanner
‍
Research Reports
FREE
RESOUrCES
Simple Backtest
Calculator
Simple Seasonality
Calculator
The Kelly Criterion
Calculator
Sentiment Geo Map
‍
Public Research Reports
‍
Education
Sentiment Indicators
‍
Technical Indicators
‍
Pricing
Bundle pricing
‍
FAQ
‍
Announcements
‍
COMPANY
‍
About
‍
In the News
‍
Testimonials
‍
Client Success Stories
CONTACT
‍
General Inquiries
‍
Media Inquiries
‍
Financial Professionals Inquiries
‍
© 2026 Sundial Capital Research Inc. All rights reserved.
Setsail Marketing
TermsPrivacyAffiliate Program
Risk Disclosure: The information and tools provided are for research and analytical purposes only and are not intended as investment advice. Market analysis involves uncertainty, and outcomes may differ from expectations. Users should conduct their own due diligence and consider their individual circumstances before making any financial decisions. Past performance is not necessarily indicative of future results.

Hypothetical Performance Disclosure: Hypothetical performance results have many inherent limitations, some of which are described below. No representation is being made that any account will or is likely to achieve profits or losses similar to those shown; in fact, there are frequently sharp differences between hypothetical performance results and the actual results subsequently achieved by any particular trading program. One of the limitations of hypothetical performance results is that they are generally prepared with the benefit of hindsight. In addition, hypothetical trading does not involve financial risk, and no hypothetical trading record can completely account for the impact of financial risk of actual trading. for example, the ability to withstand losses or to adhere to a particular trading program in spite of trading losses are material points which can also adversely affect actual trading results. There are numerous other factors related to the markets in general or to the implementation of any specific trading program which cannot be fully accounted for in the preparation of hypothetical performance results and all which can adversely affect trading results.

Testimonial Disclosure: Testimonials appearing on this website may not be representative of other clients or customers and is not a guarantee of future performance or success.