
What you need to know about credit default swaps

Key Points
- Credit default swaps are a little understood derivative that allows the various parties to swap the exposure of default of an underlying bond
- The more fear there is of a default, the more the seller of a CDS will charge to assume the risk
- When this fear becomes widespread (generally during times of economic uncertainty), CDS prices rise across the board, and the CDX Index reflects this by increasing in value (and vice versa)
- A rising CDX Index reflects uncertainty - and at times, fear - regarding the economy and/or the financial system
- The stock market hates uncertainty
Credit Default Swaps (CDX Index)
Over the past few years, one of the fastest-growing derivatives markets is for credit default swaps (CDS). A CDS allows the various parties to swap the default exposure of the underlying credit (i.e., bond). For example, the investor in a relatively risky bond might be uncomfortable that the bond's issuer could default on their payments. To hedge that risk, the investor buys a CDS.
When they buy the CDS, the investor pays another trader (the seller) a periodic payment. That other trader then takes on the risk that the bond's issuer will default. If that happens, the seller is responsible for paying the bond investor an agreed-upon amount. This allows the original investors to offset some of their risks, allows the seller to generate a stable flow of income, and allows the bond market to enjoy more liquidity. Of course, just like selling options, the seller of a CDS takes on possibly significant risks, and a major system-wide event could trigger a massive wave of trouble since this market has become so huge.
The indicator posted to the site tracks an index created by Dow Jones, which monitors the spread between credit default swaps on high-yield (i.e., junk) bonds and Treasury securities. The higher the index, the wider the spread - which means that credit investors are more and more worried about defaults and are willing to pay higher prices for default protection.
We expect it to track volatility measurements like the VIX quite closely as times of fear should see this index spike higher, and times of complacency should see it become very subdued. In that sense, it is a contrary indicator.
One objective application for stock market investors
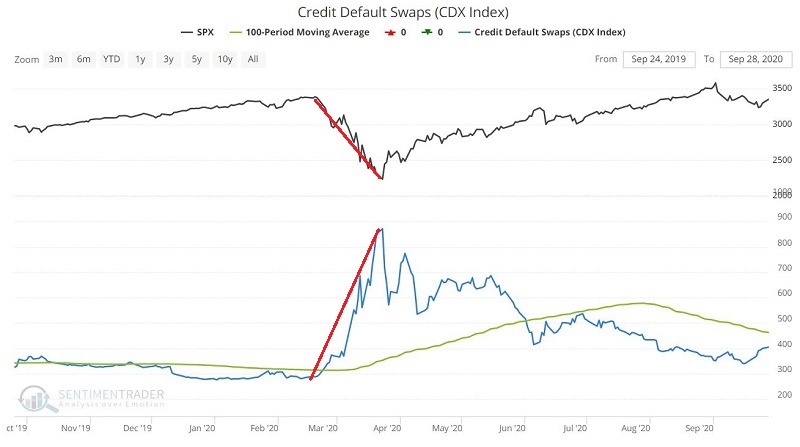
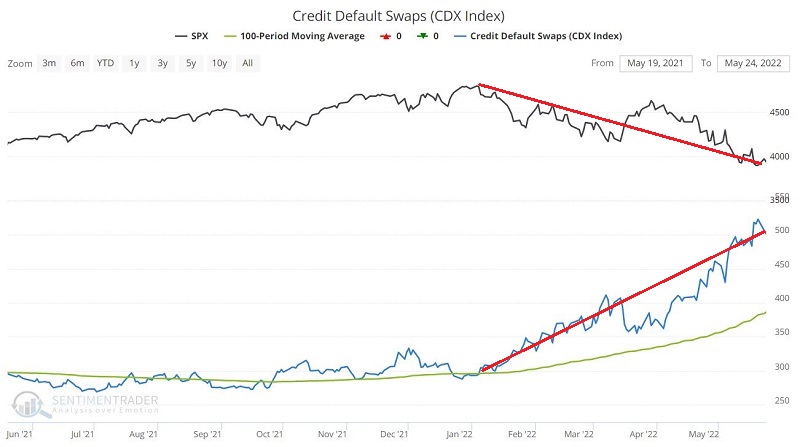
The chart below displays the CDX Index along with a 100-day moving average. Note that at times the index "spikes" sharply higher. These spikes represent a rising level of uncertainty and/or fear in the financial markets and are almost invariably bad for stock investors.
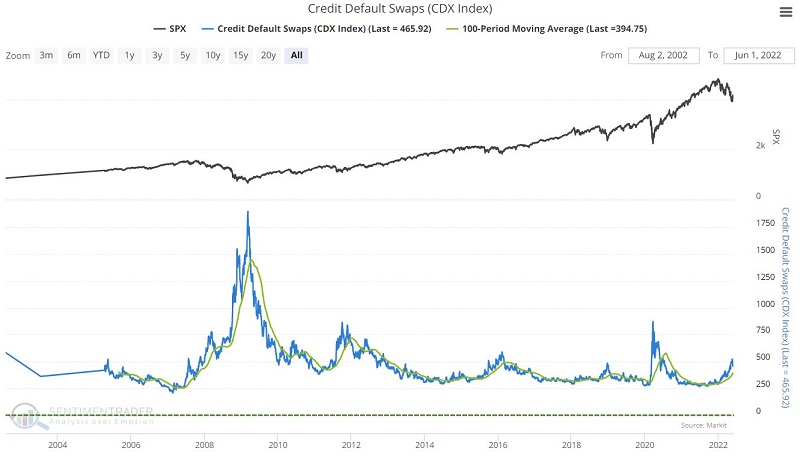
The rules are simple:
- CDX Index < 100-day moving average = Favorable for stocks
- CDX Index > 100-day moving average = Unfavorable for stocks
How the market reacts to rising credit spreads
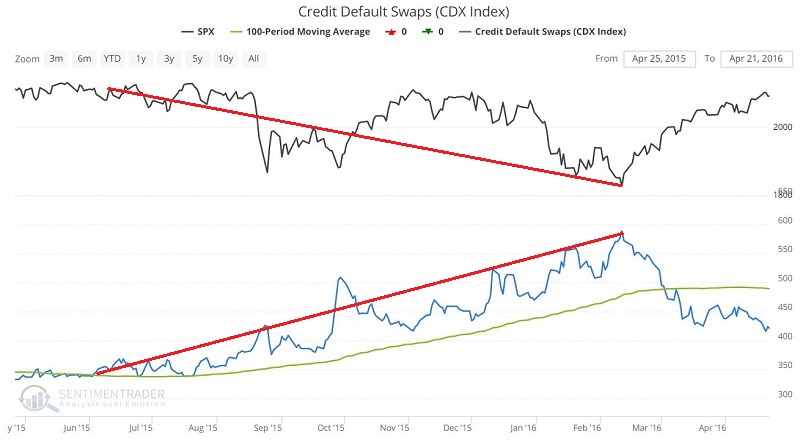
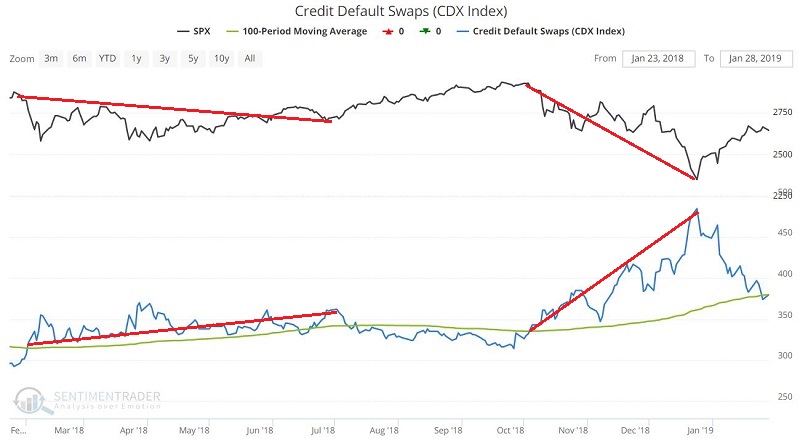
Rising credit spreads signal stress in the financial system and increased investor uncertainty. As the old adage states, "The market hates uncertainty." To illustrate this point, let's take a somewhat harrowing look down memory lane.
2007-2008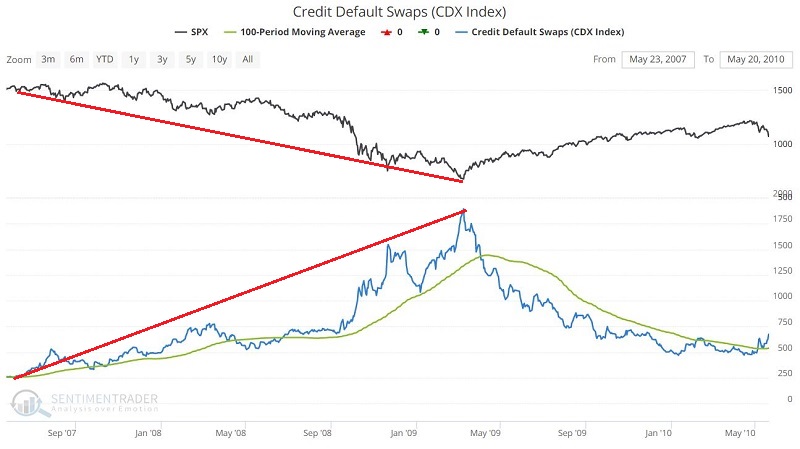
2015-2016
2018
2020
2021-2022
The Results
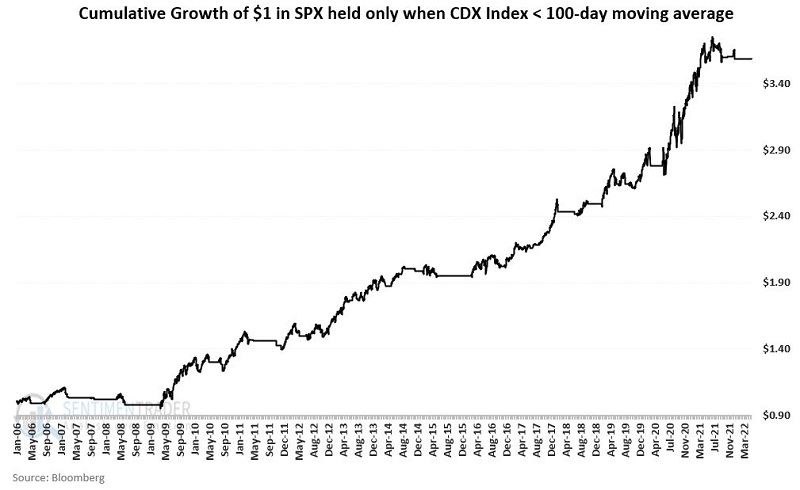
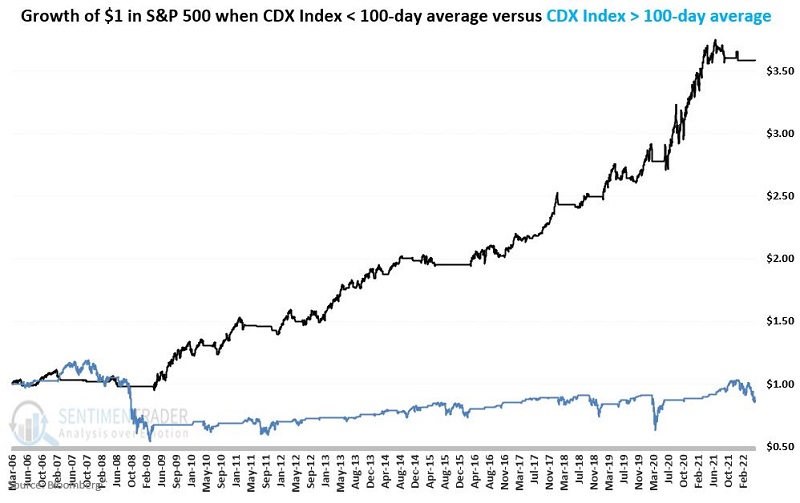
The chart below displays the growth of $1 invested in the S&P 500 Index only when the CDX Index is below its 100-day moving average. Note the steady move from the lower left to the upper right and the lack of significant drawdowns.
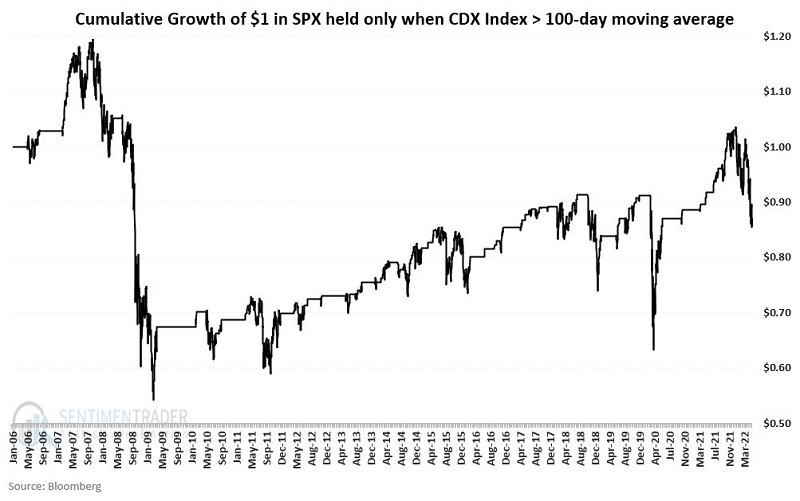
The chart below displays the growth of $1 invested in the S&P 500 Index only when the CDX Index is above its 100-day moving average. Note the extreme choppiness and significant drawdowns. As I said, the market hates uncertainty.
For more context, the chart below overlays the above charts together. The difference in performance is quite stark.
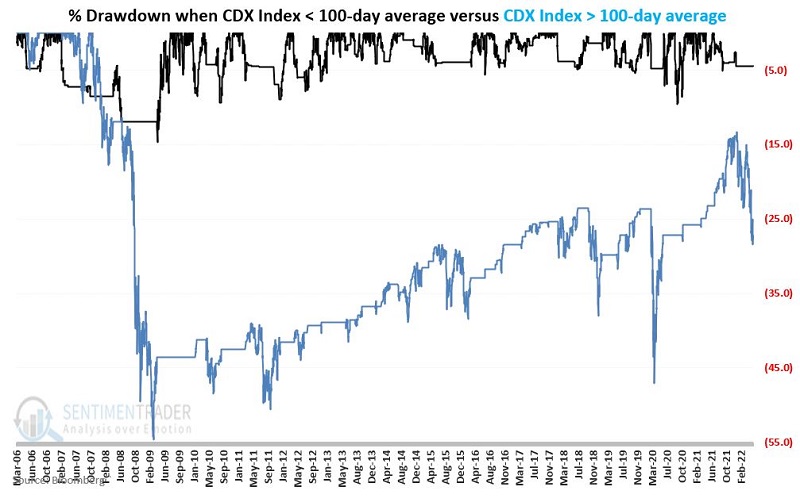
Finally, the chart below displays the % drawdowns for the S&P 500 Index depending on whether the CDX Index is below its 100-day average (black line) or above (blue line).
What the research shows…
Like the VIX Index, the CDX Index measures "fear" in the marketplace. Whereas the VIX measures uncertainty based on the implied volatility of SPX options, the CDX Index does something similar based on the spread between credit default swaps on high-yield bonds and Treasury securities. As the charts above illustrate, a significant rising trend in the CDX Index is a valuable warning sign for stock investors.