
What Walmart's run is suggesting about sentiment

Key points:
- Investors piled into Walmart stock over the past month, pulling it well ahead of the average S&P 500 stock
- Similar jumps in the ratio of Walmart to the average stock have tended to occur near recessionary periods
- Short-term returns in the average stock were volatile, but over longer periods, these panic periods were opportunities
The rush to safety
When times are uncertain, consumers pull back. They buy fewer things and try to spend less, making retailers like Walmart uncommon beneficiaries during difficult times.
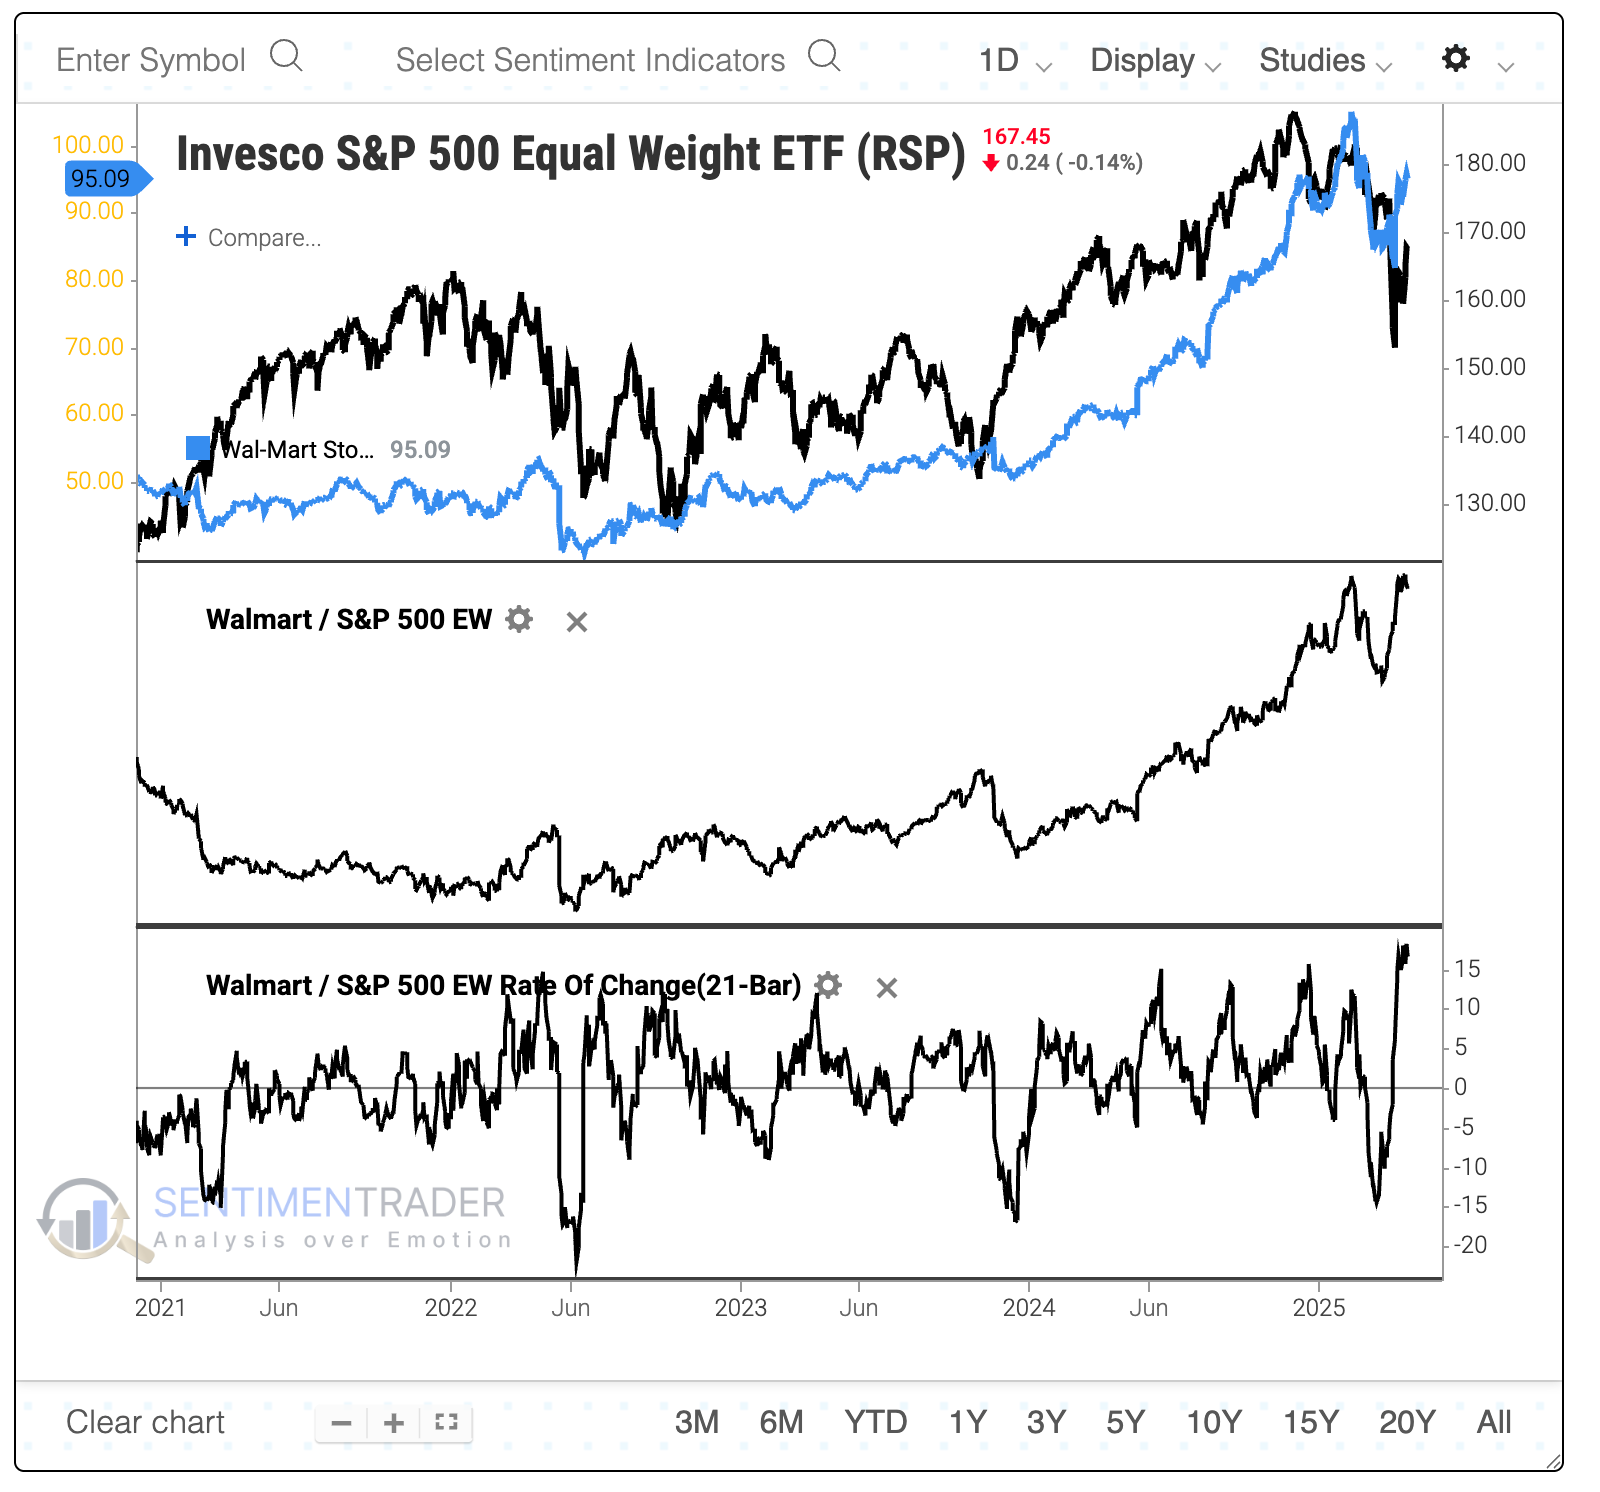
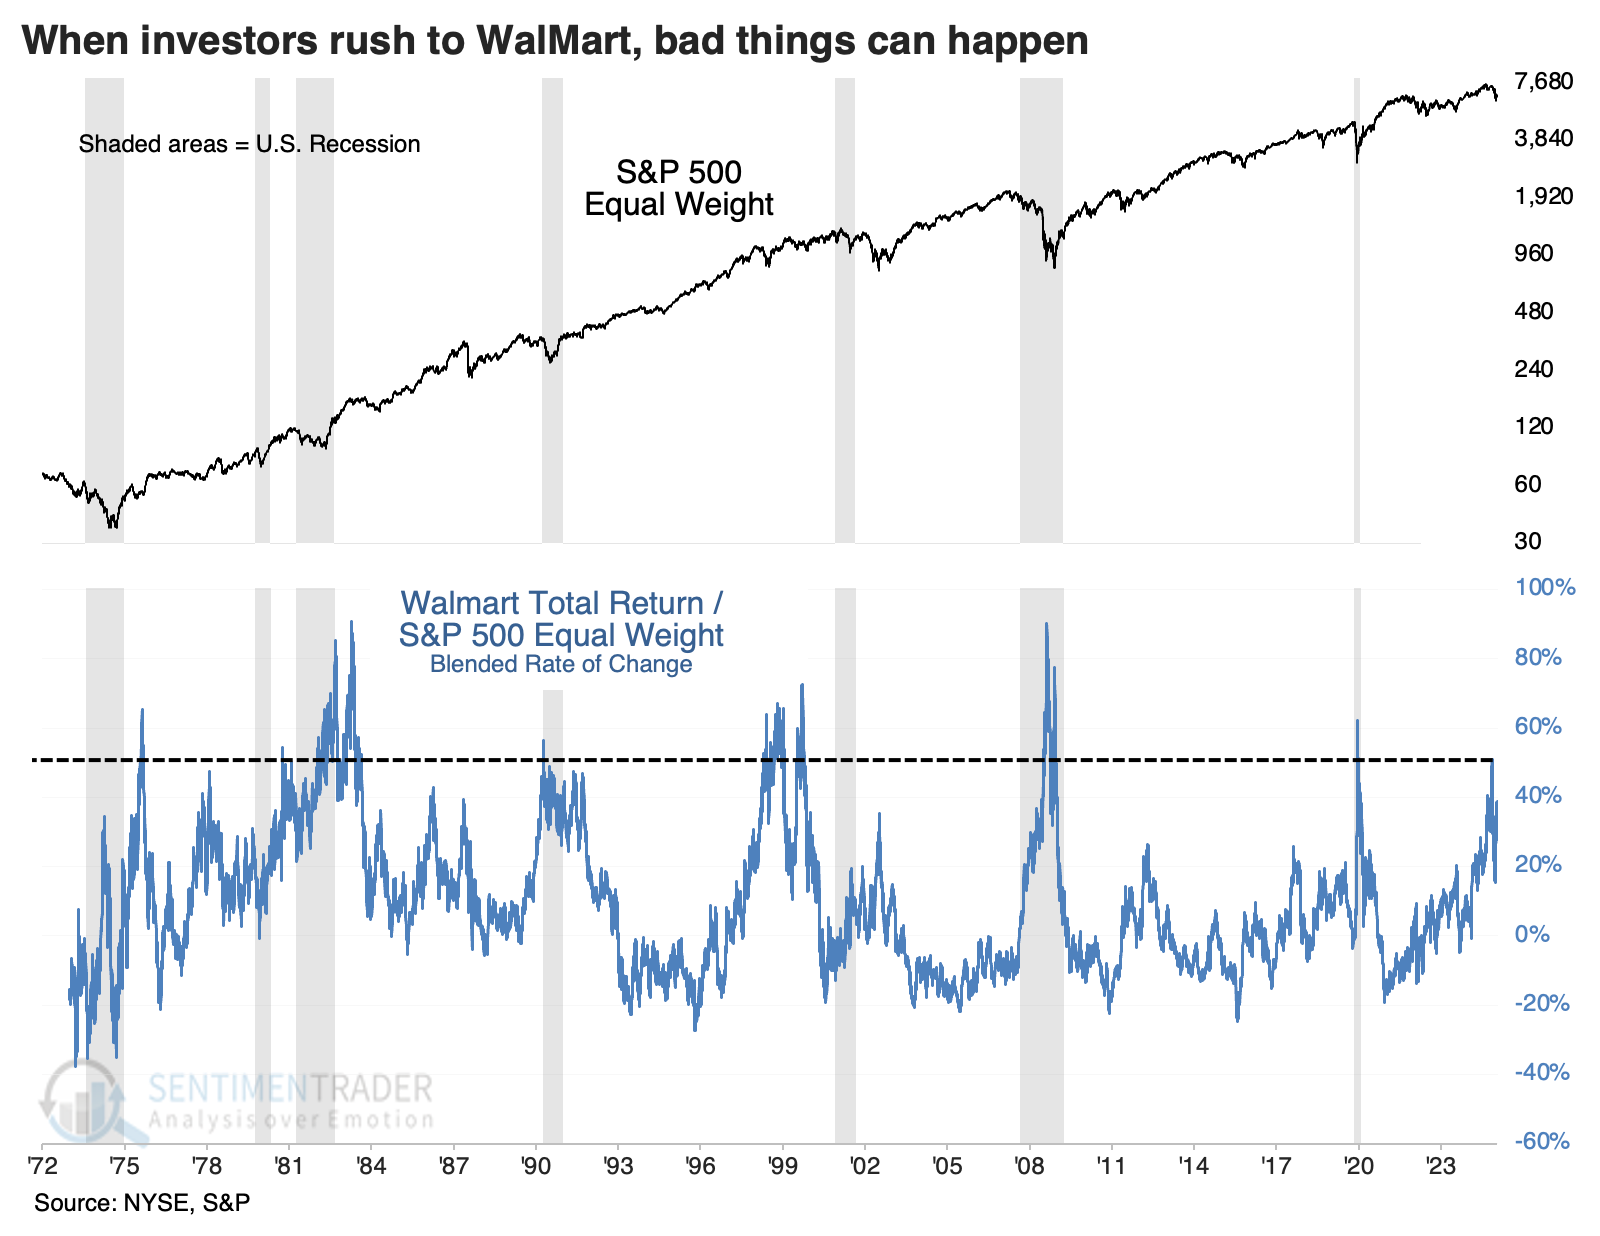
Until the past few sessions, investors have recognized this possibility and priced it in. Relative to the average stock in the S&P 500, Walmart stock has soared. As stocks plunged into last week, Walmart held up, pushing the ratio between Walmart stock and the S&P 500 equal-weight ETF (RSP) to the highest level since 2009. The one-month rate of change in the ratio neared 20%, hinting at panic.
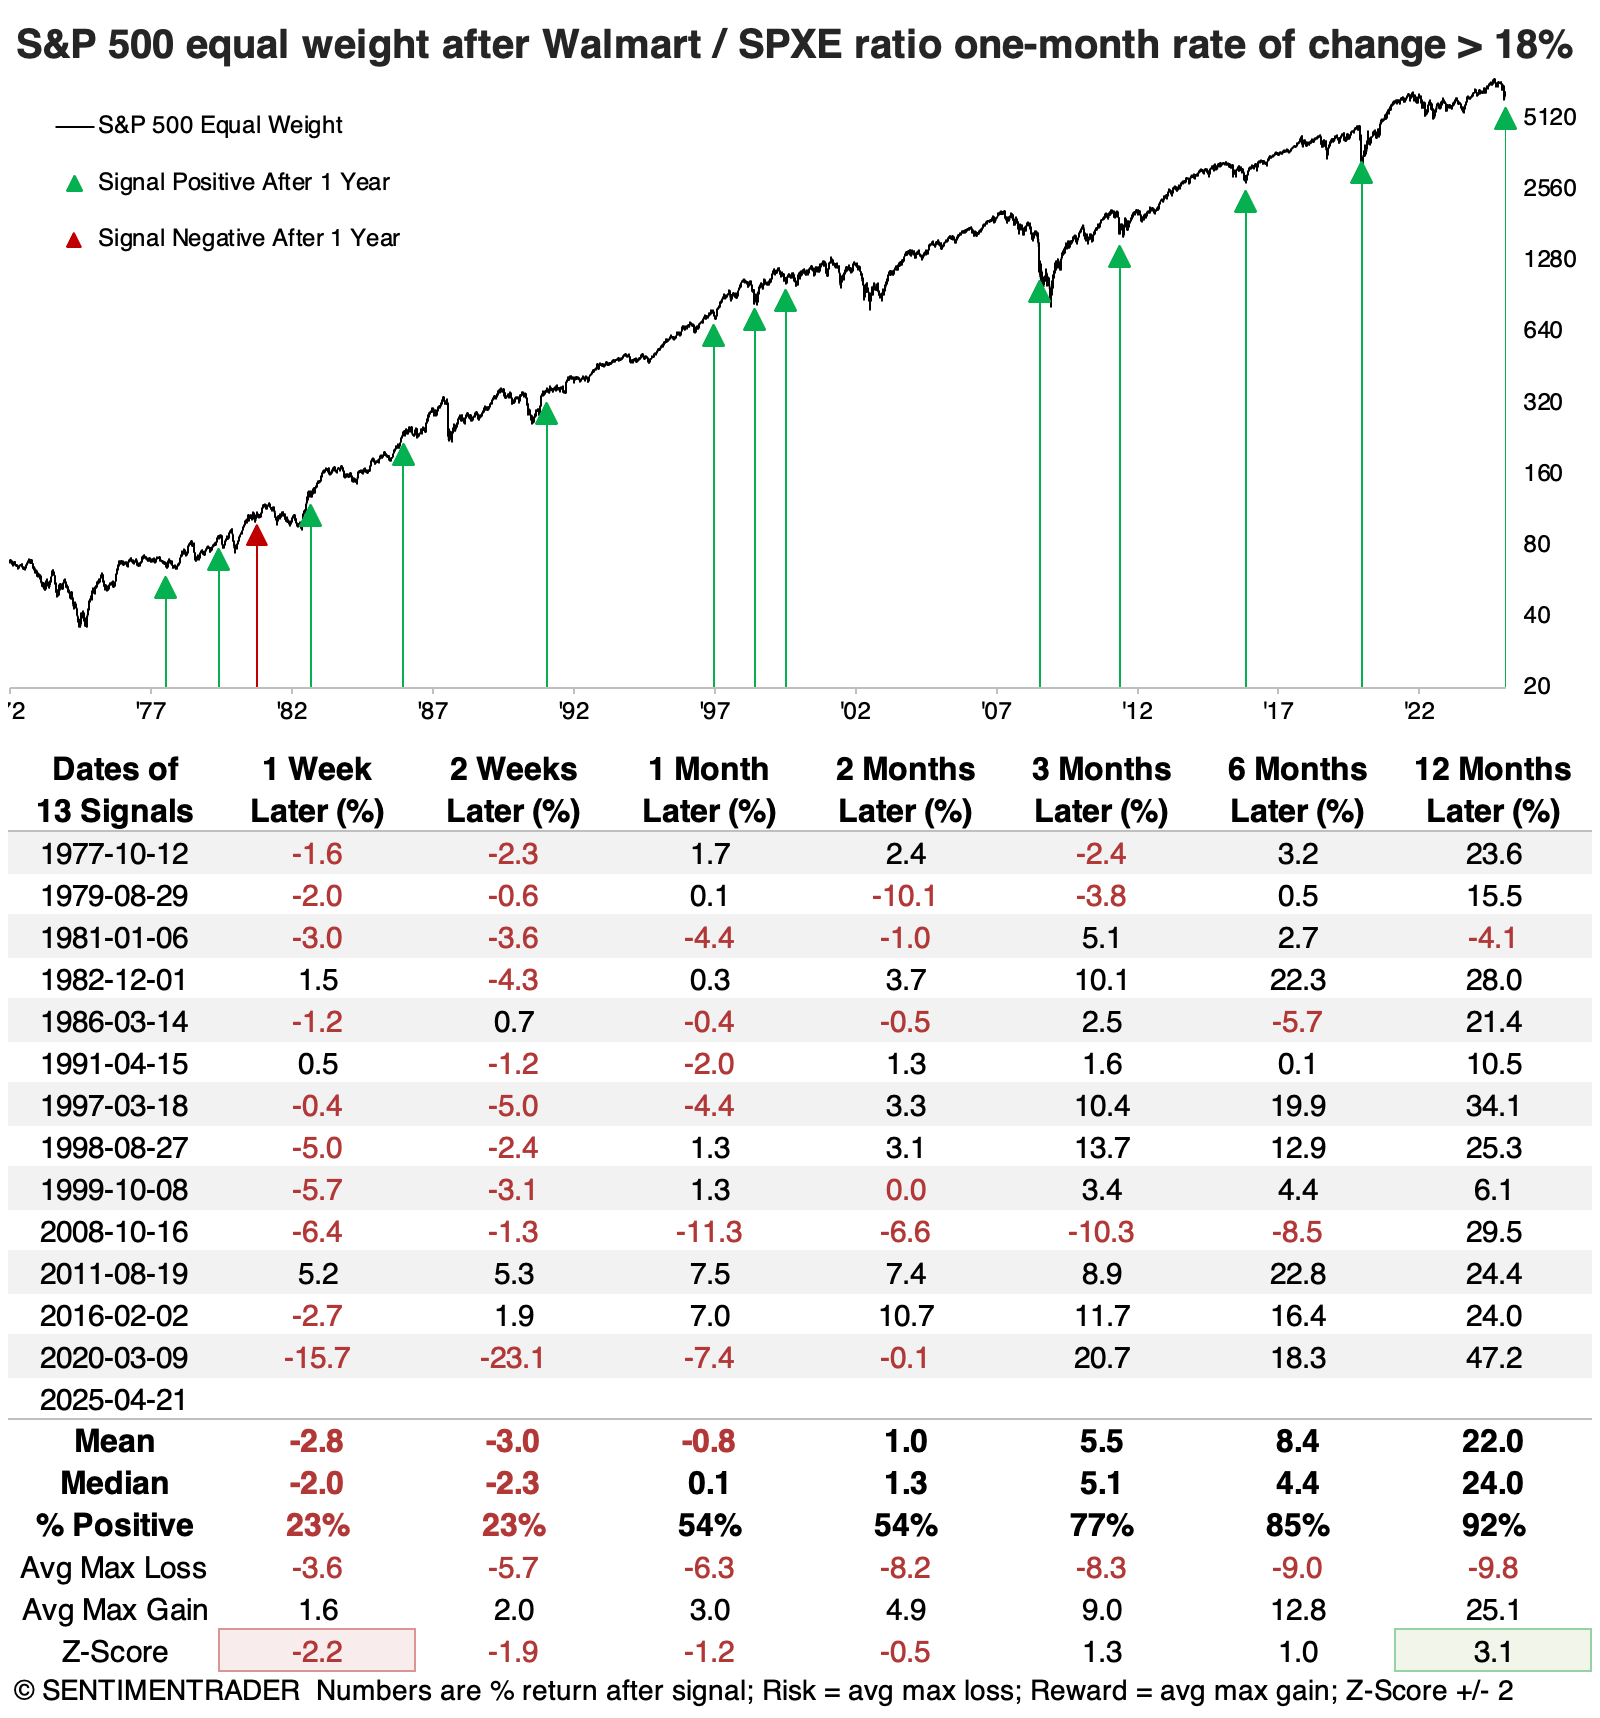
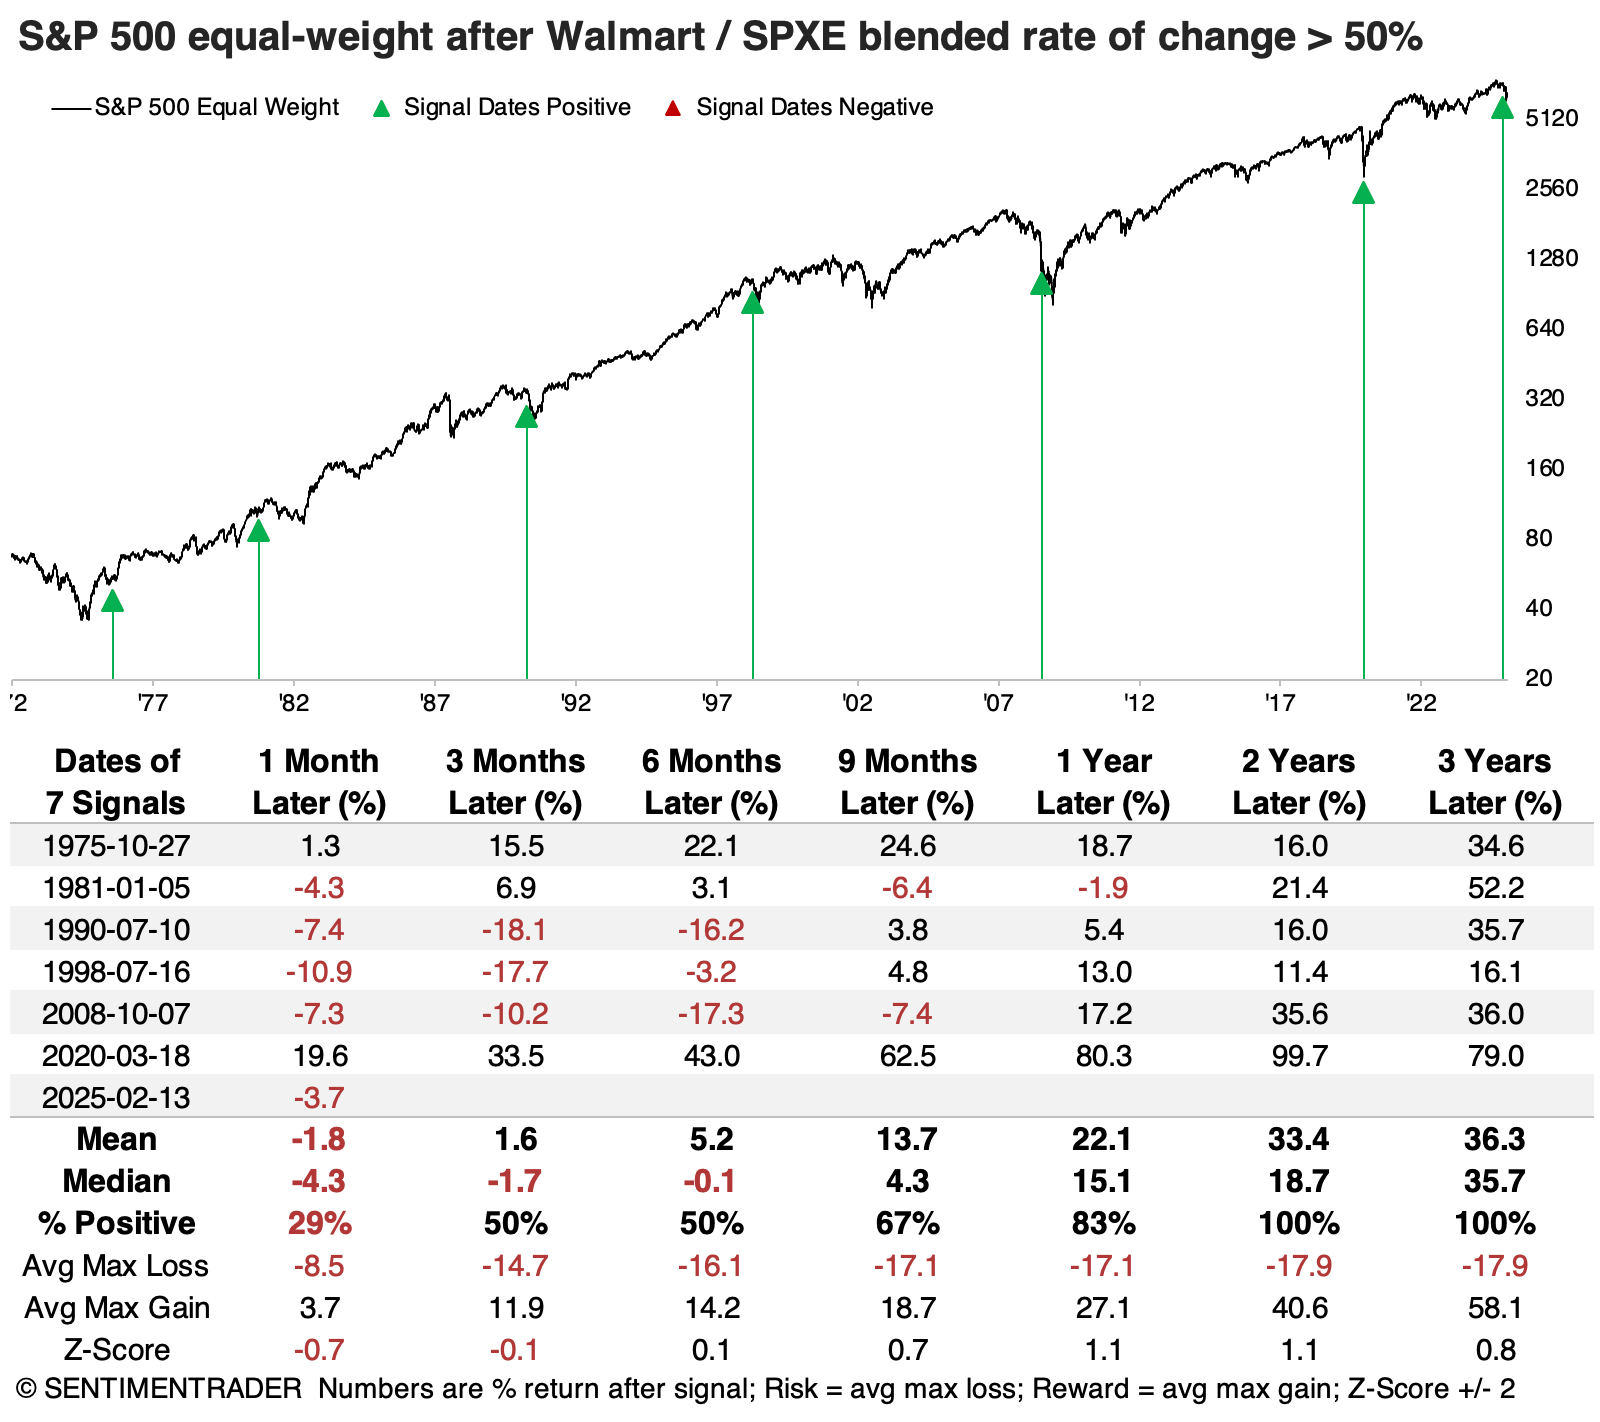
If we go back to when Walmart listed on the NYSE in 1972, we can look at other times when the ratio between that stock and the average S&P stock soared.
The table below shows these instances, and it's evident that the equal-weight S&P tended to suffer in the short term - only one signal avoided a loss, either one or two weeks later. So far, the broader market has recovered nicely; this might be the second such signal. Regardless, the average stock did well over the following 6-12 months with a median 12-month return of +24% and only one minor loss.
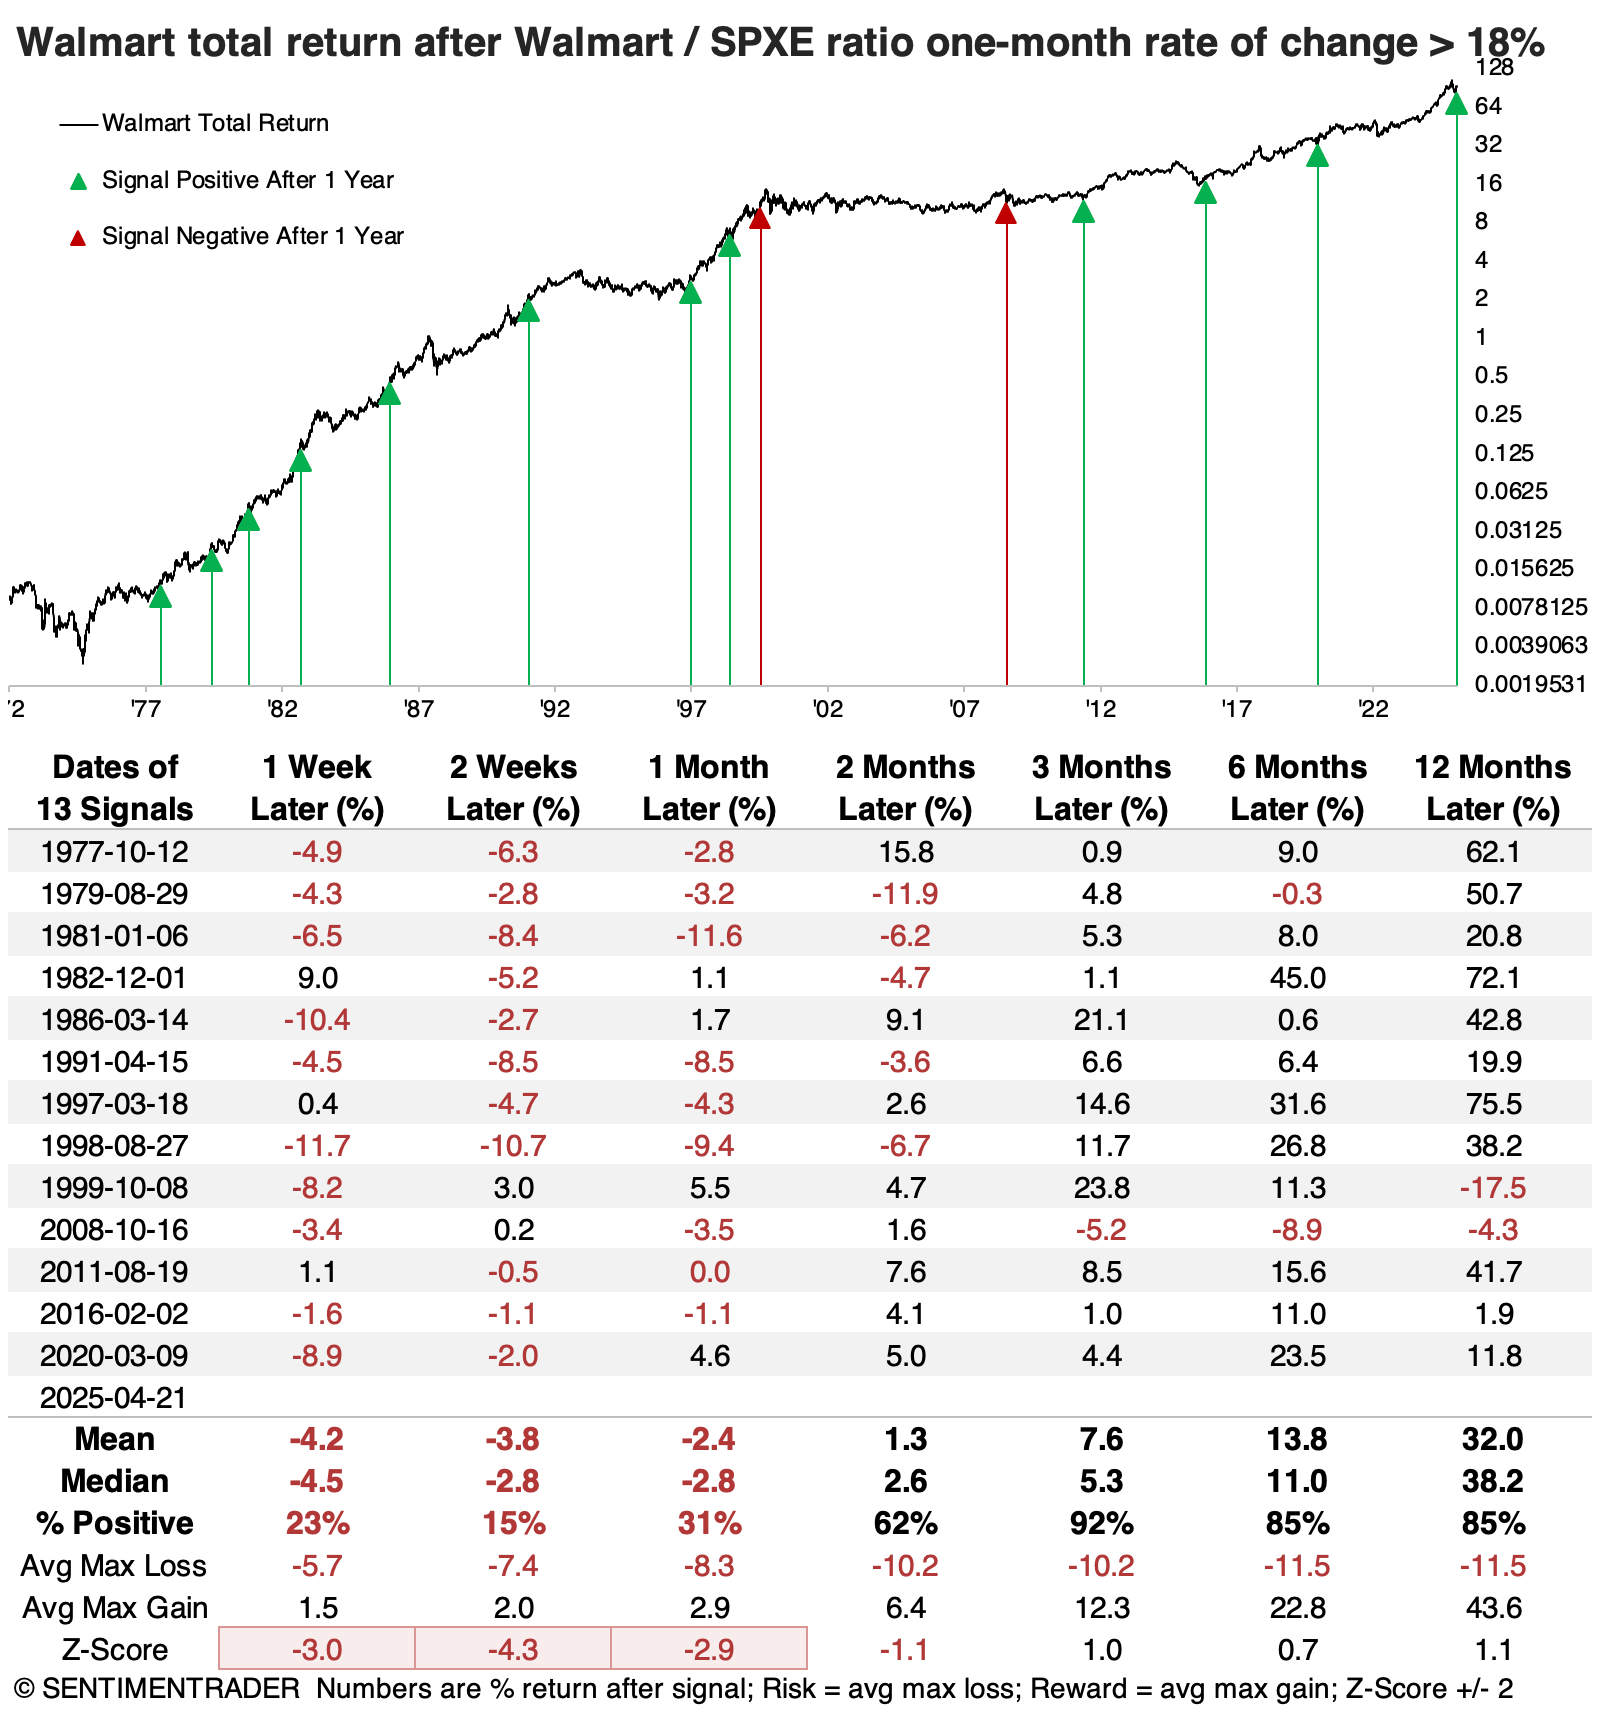
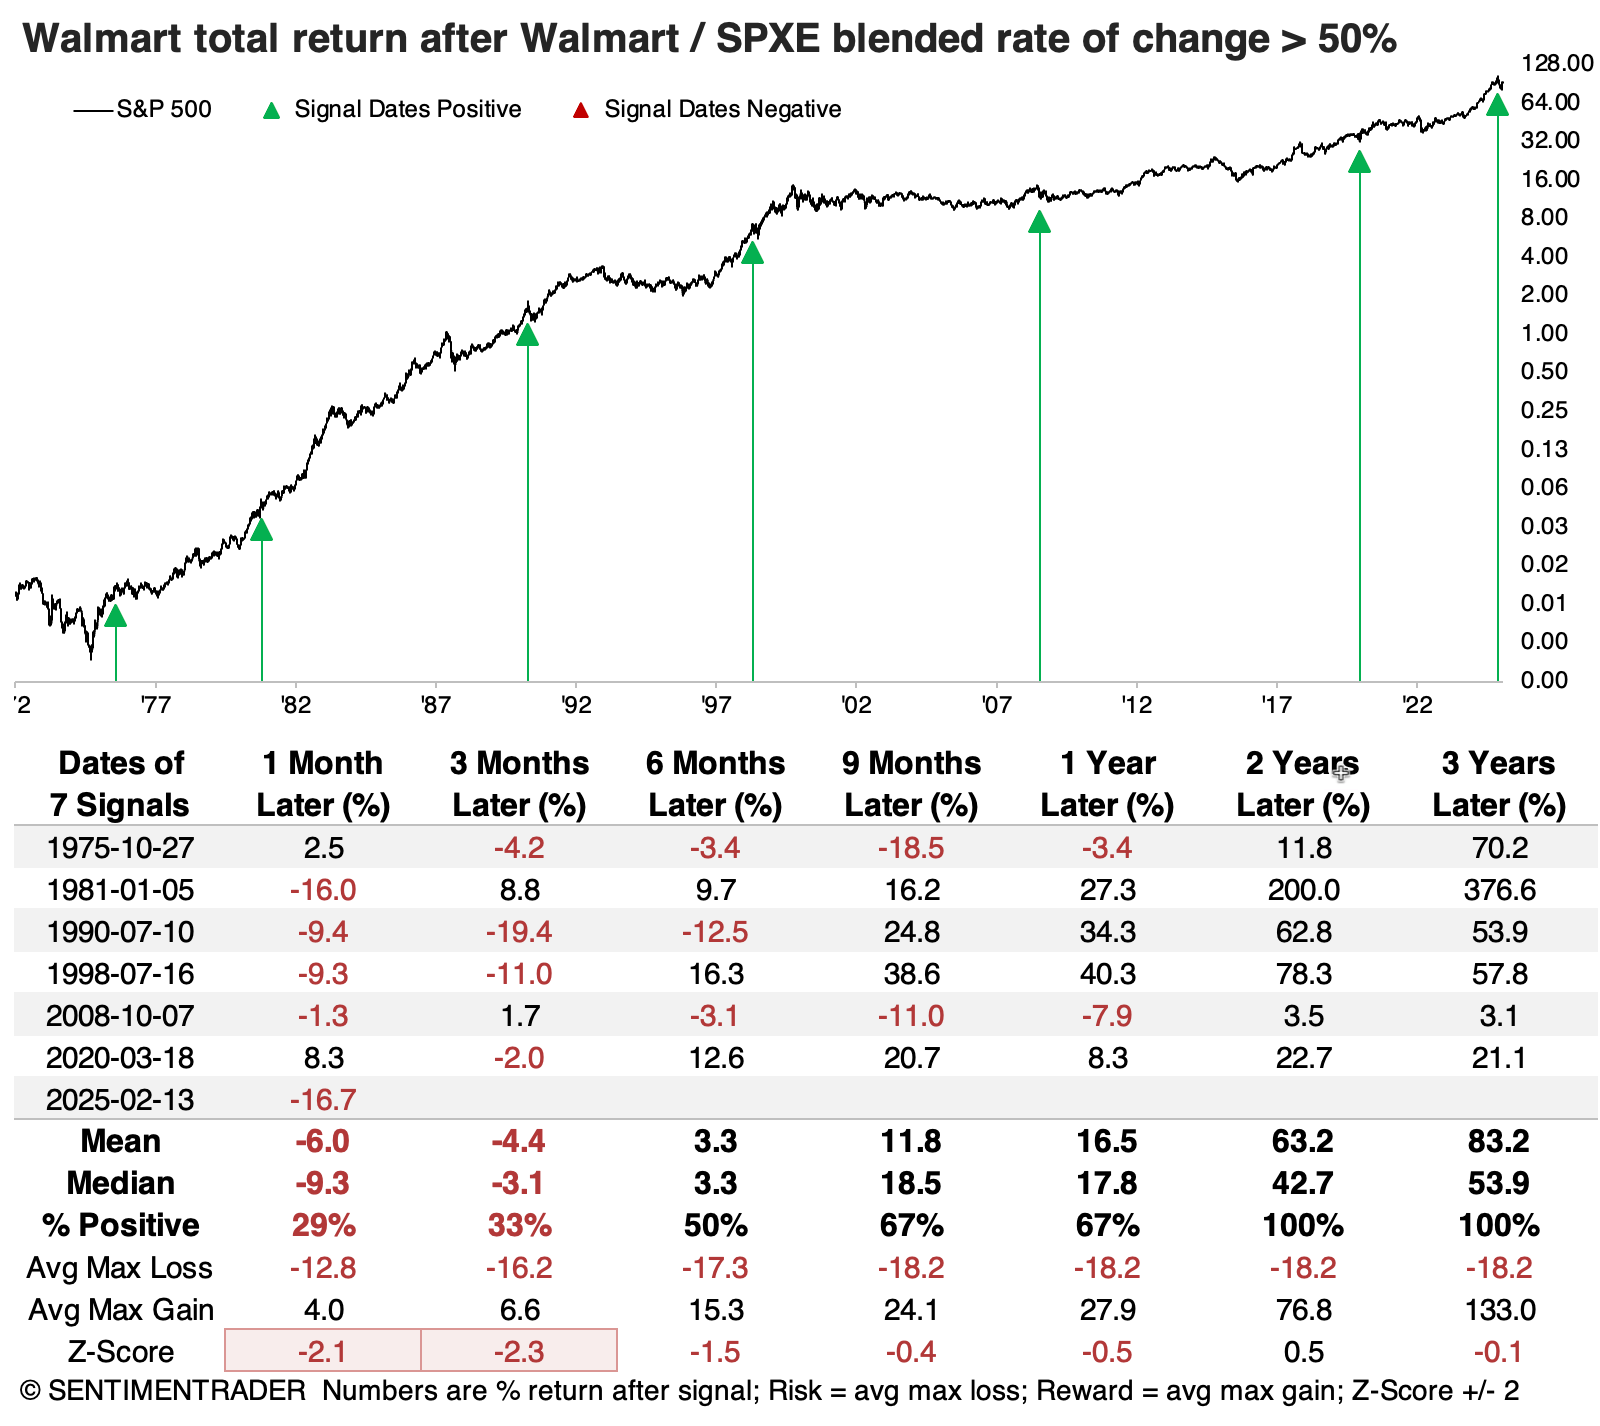
Walmart also tended to see short-term weakness, with exceptionally poor two-week returns. Those, too, were temporary losses, which is not surprising for one of the best-performing stocks in history; it showed only one loss three months later.
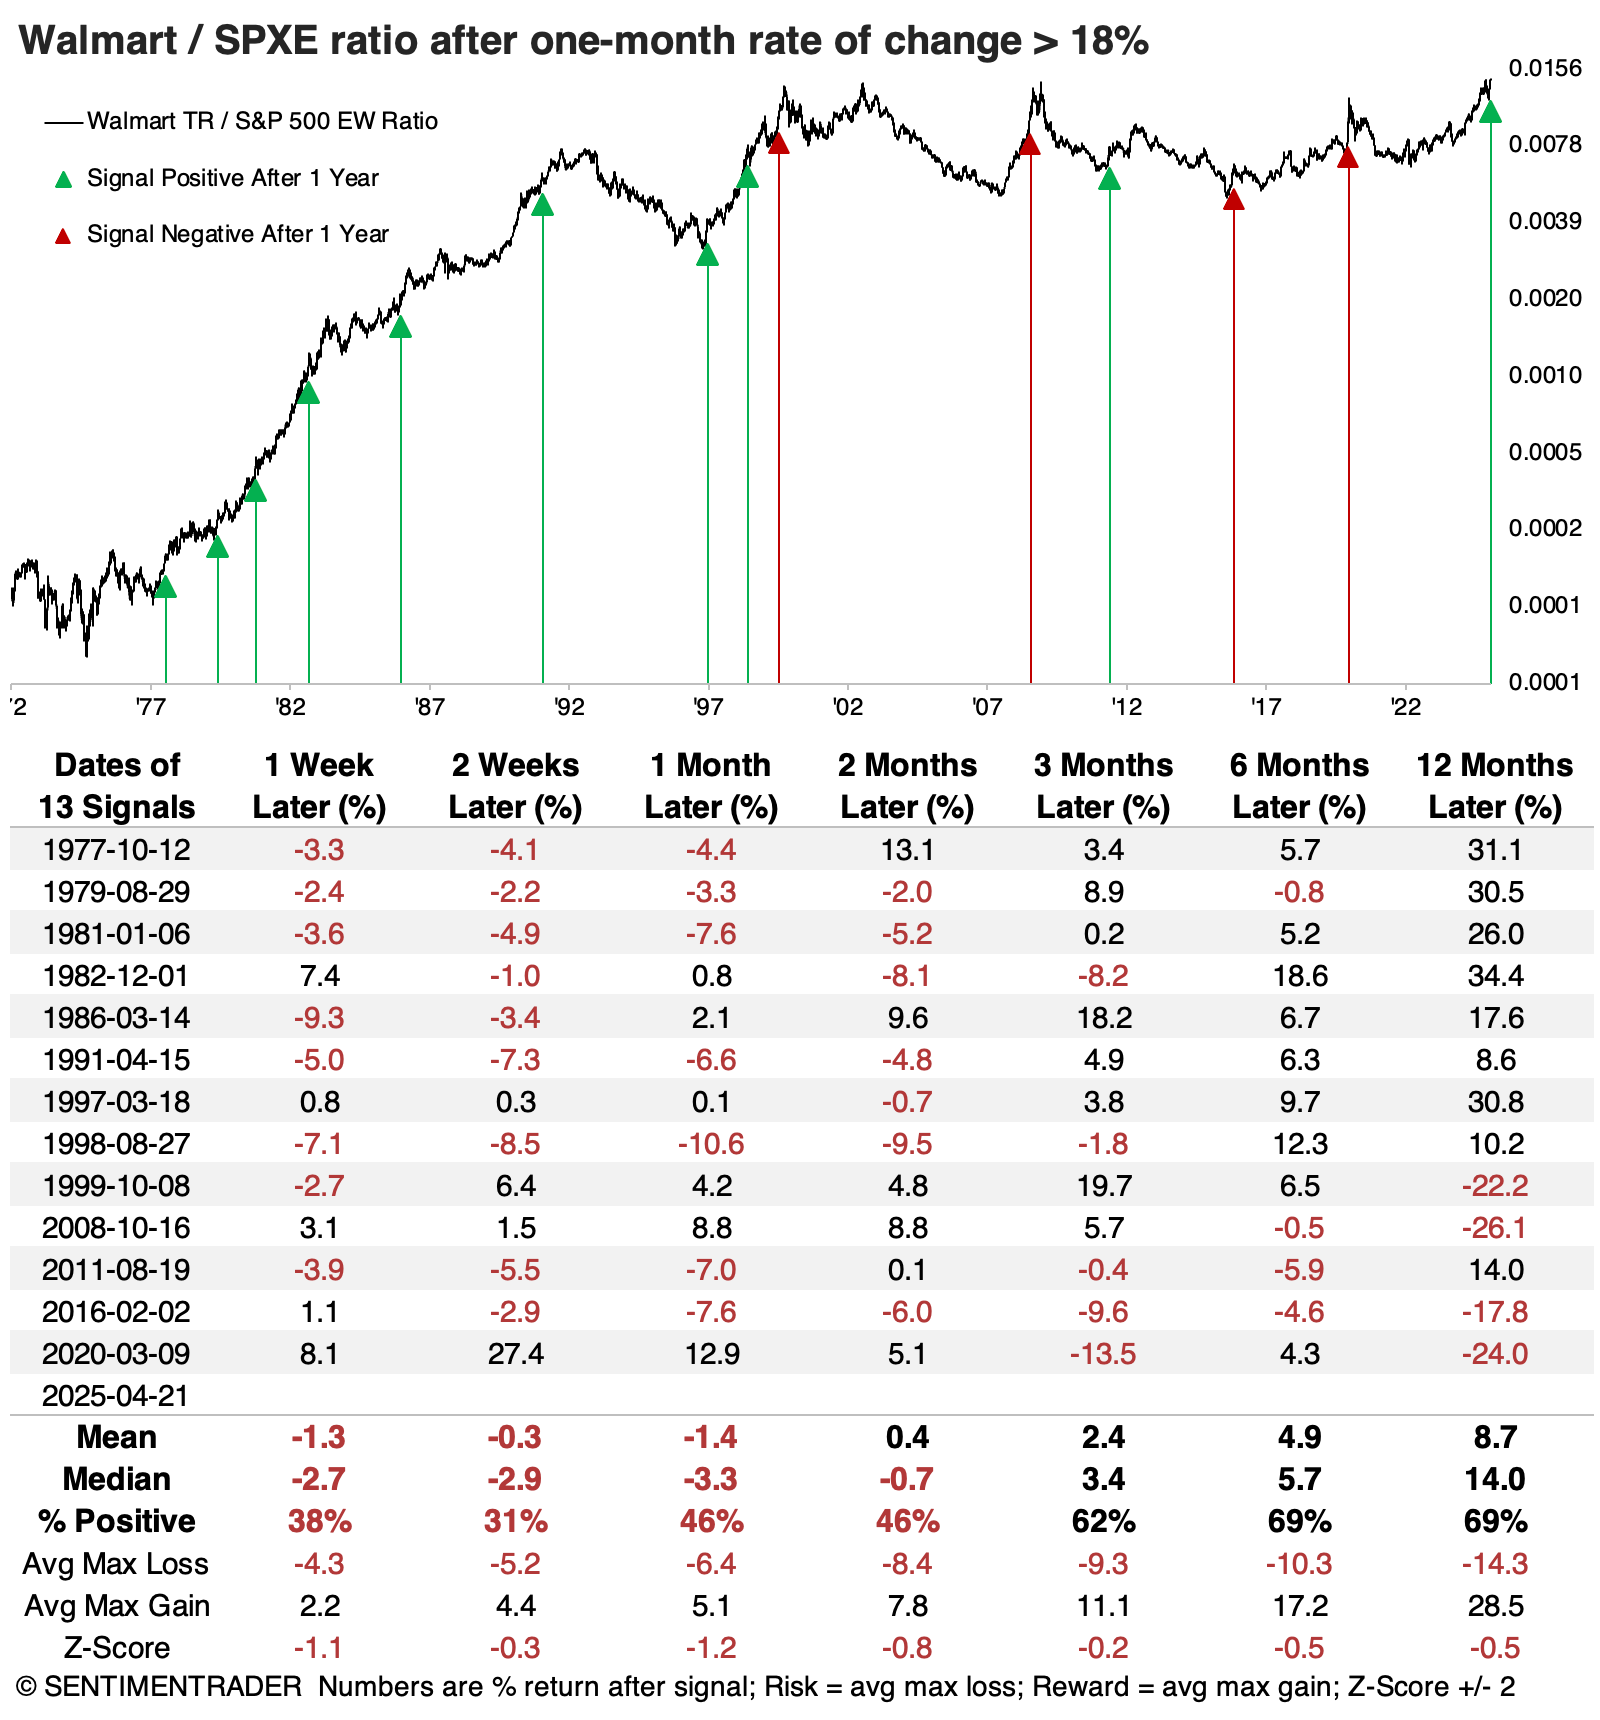
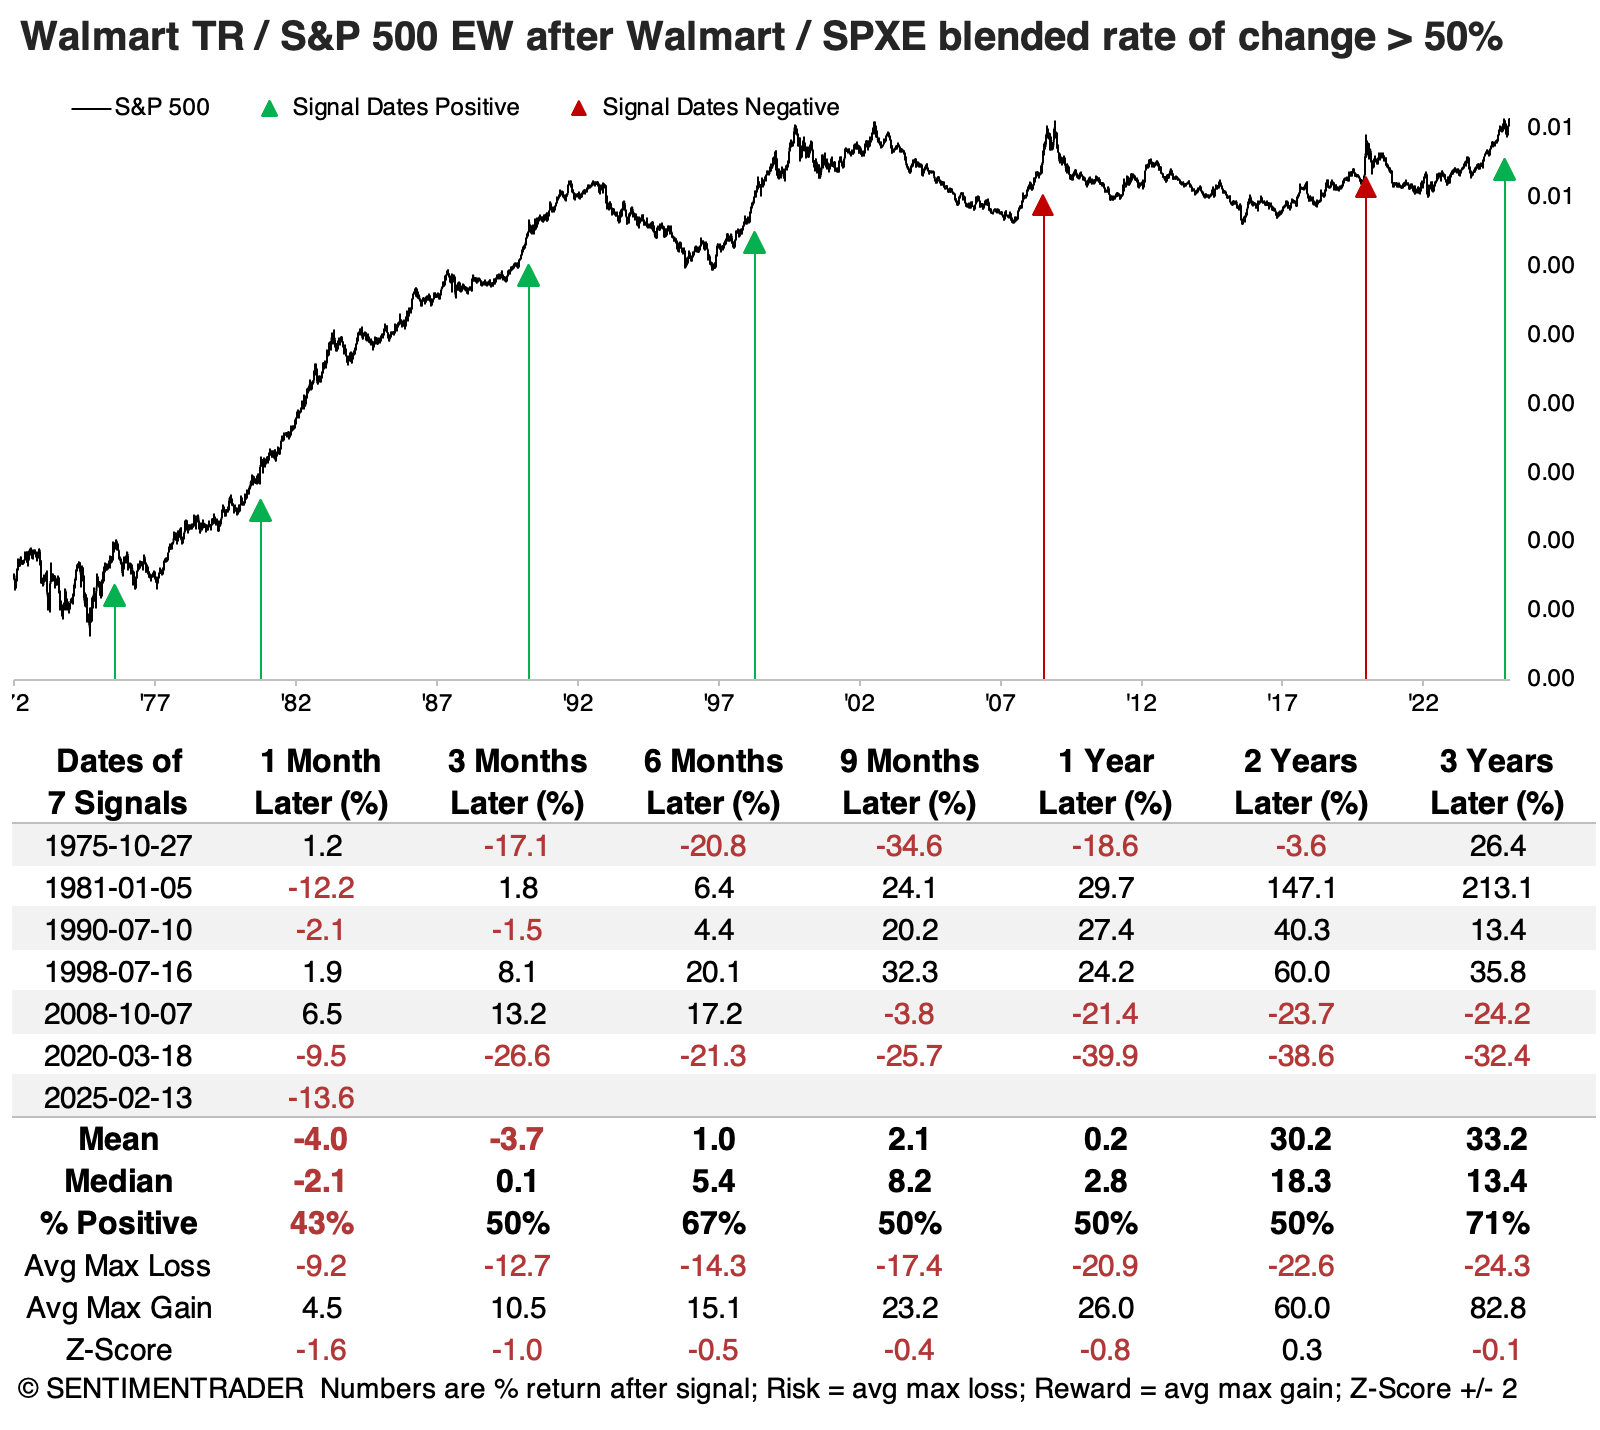
If we look at the ratio between Walmart and the equal-weight S&P 500, we see that since the year 2000, these signals have tended to occur around relative peaks in the stock. The only exception was in 2011, when Walmart continued to outperform the average S&P stock over the next year...but not without stumbles in the interim.
A longer-term view
Let's zoom out.
Walmart hasn't just done well over the past month; it has also outperformed the average stock handily over 3, 6, 9, 12, and 24 months. The chart below shows the rate of change in the ratio across all time frames, and it exceeded 50% in February. As the chart shows, this tended to occur around U.S. recessionary periods.
In keeping with the long-term view, the table below shows returns in the S&P 500 equal-weight index over longer time frames. Short-term returns tended to be poor (which we saw once again), but after about a year, they were above-average.
Walmart stock was hard to keep down, but its returns were below average, even considering some exceptional runs after a few of them.
The ratio between them shows that Walmart continued to outperform over the next 1-2 years after the signals in 1981 and the 1990s, but the last two signals were relatively near long-term peaks in the ratio.
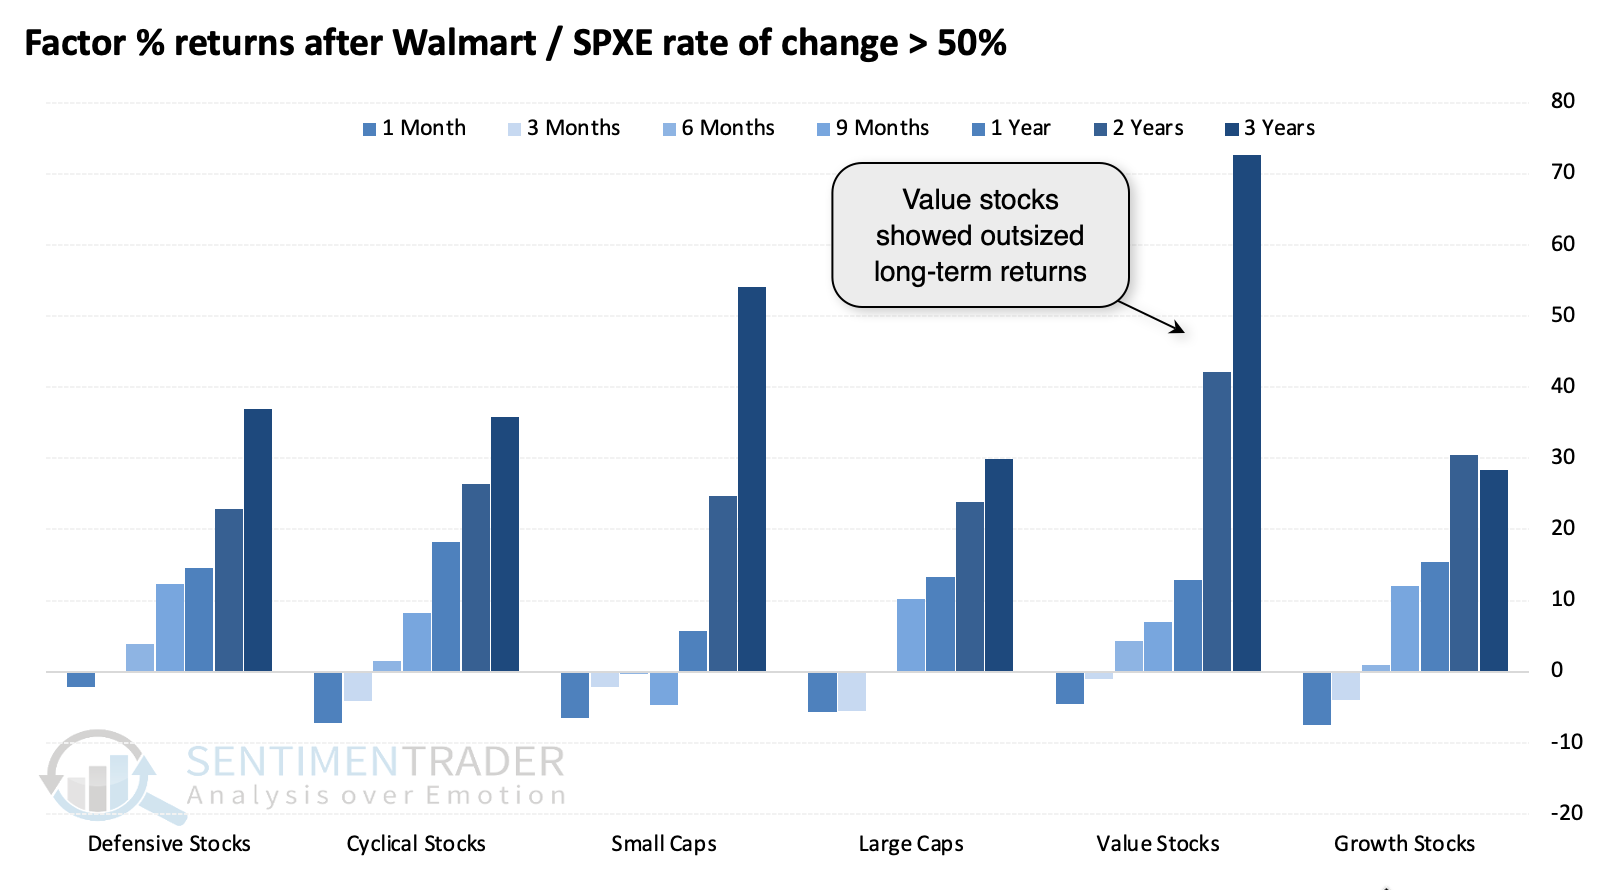
There were not really any standouts among sectors following these signals, but value stocks stood out for long-term returns among factors.
What the research tells us...
There was no shortage of signals indicating investor panic heading into last week. We can add the rush into Walmart stock to the list, and it has been a relatively good indicator of investors' rush to safety. During these periods, almost always around actual or feared recessions, stock returns tended to be highly volatile over short time periods. But like other periods of high volatility and uncertainty, medium- to long-term returns tended to be positive and above-average.