
What to focus on in the metals markets

Key points
- Seasonality is best used as a tool to tell you "When to look where" for potential opportunities, and not as a standalone trading model
- When price trend and seasonality align, great opportunities can arise. When price trend and seasonality diverge, it can serve as an alert that the current price trend may be due for a pause or reversal
- This note looks at the current seasonal outlook for metals, including gold, silver, copper, palladium, and platinum
Gold is soaring
Gold has advanced 80% in the past 19 months, as it appears to have taken the place of treasury securities as the market's "safe haven." And at the moment, there is no reason to fight against that trend. The following information is not intended to convince you that you should sell short gold into the teeth of this advance. Nor is it an attempt to pick "the top." The case being made here is not that gold is about to top out and embark on a significant bearish trend, but that the advance in gold could soon cool off and experience some meaningful pullback. While short-term traders may find an opportunity to play the short side, the real point is to warn investors against expecting the straight-line nature of gold's advance to continue unimpeded.
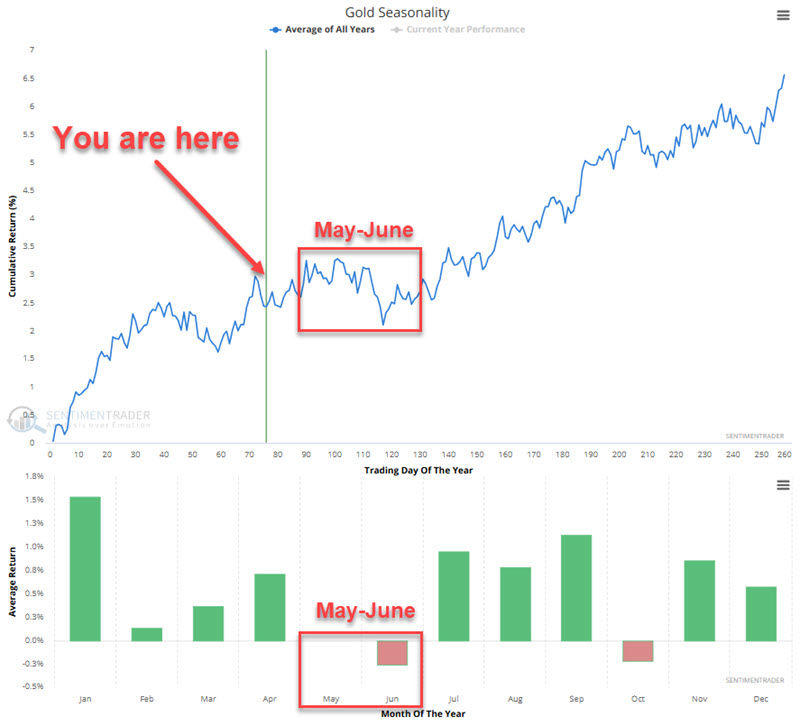
The chart below displays the annual seasonal trend for gold futures. Note that the May/June period has a history of experiencing below-average performance.
The chart below displays the hypothetical growth of $1 invested in gold only between Trading Day of the Year #84 and TDY #126 (i.e., the bulk of May and June).
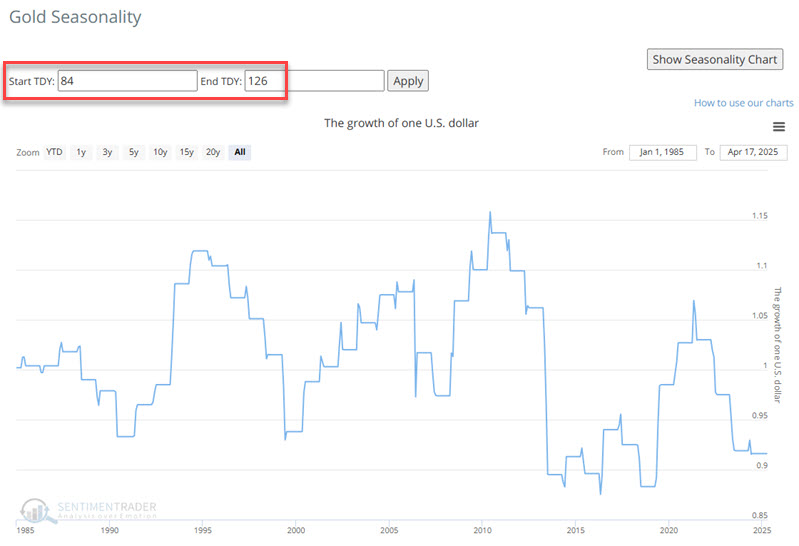
The results in the chart above have no real rhyme or reason, which is the point. The assertion is NOT that gold is about to plunge, but instead that if gold is going to cool off, the next two months seem like a likely time for that to happen.
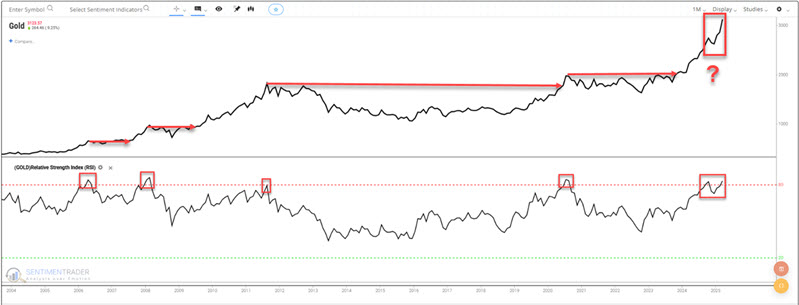
Also note in the chart below that the 14-month RSI for gold has recently been above 80%. Historically, this has presaged "cooling off" periods of varying lengths for gold.
Silver is entering a period of typical seasonal weakness
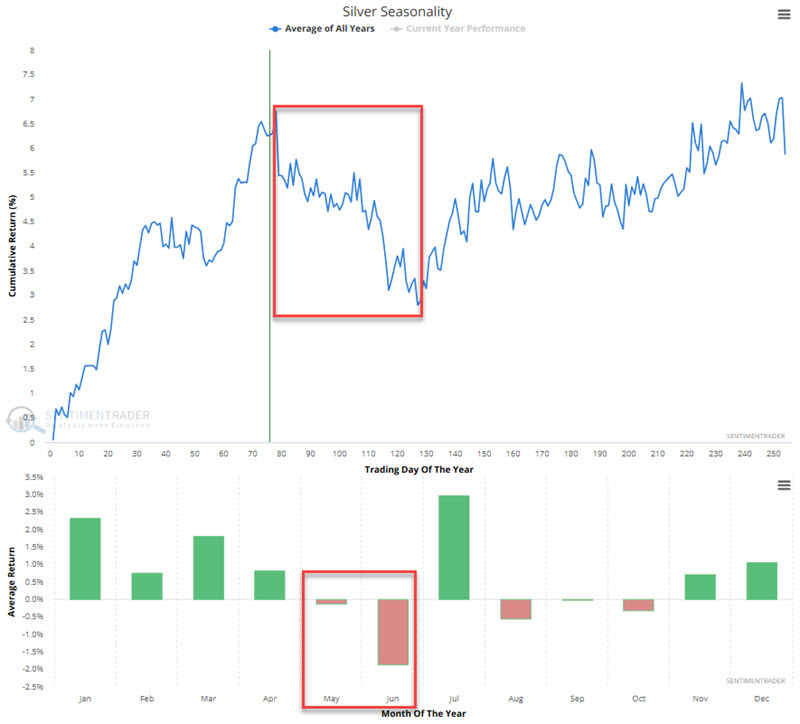
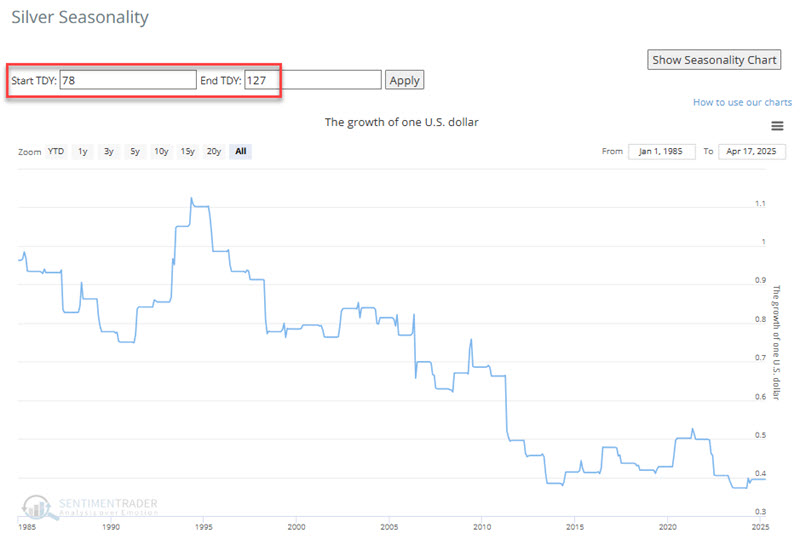
The chart below displays the annual seasonal trend for silver futures. The red box highlights the period from TDY #78 through TDY #127 as a period of typical weakness. This period starts at the close on 2025-04-21.
The chart below displays the hypothetical growth of $1 invested in silver only between Trading Day of the Year #78 and TDY #127.
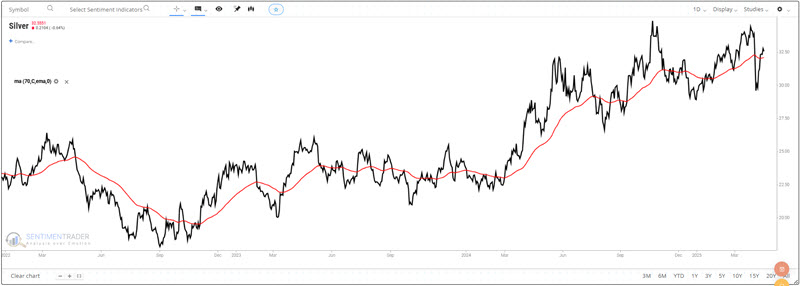
The chart below shows that silver has retaken its 70-day exponential moving average. A drop below that level during the unfavorable seasonal period above would be a significant warning sign for silver bulls and mark a potential opportunity for silver bears.
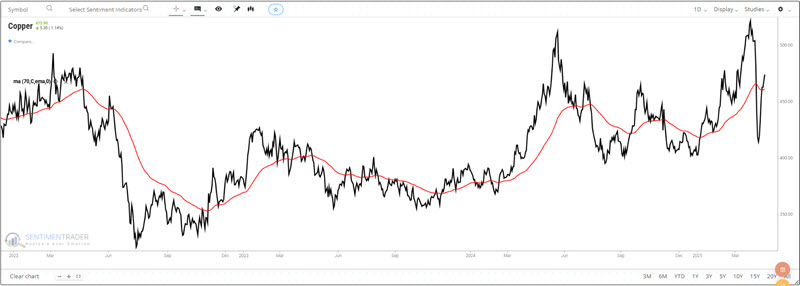
Copper's seasonally weak period is still a few weeks out
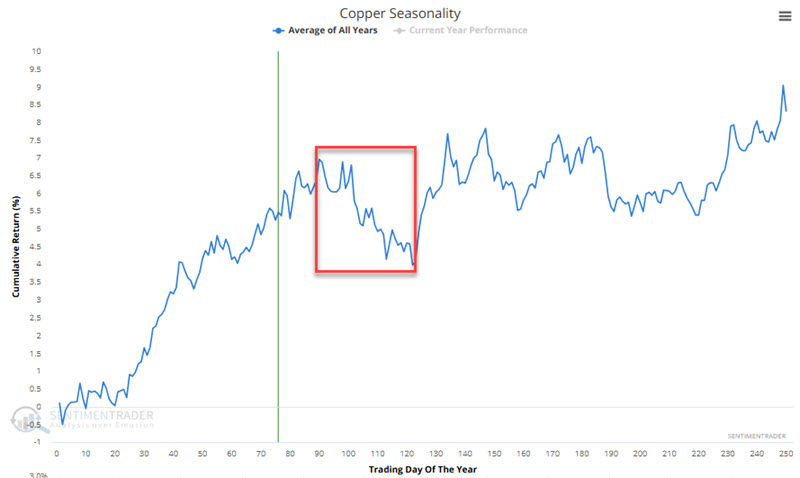
The chart below displays the annual seasonal trend for copper futures. The red box highlights the period from TDY #91 through TDY #122 as a period of typical weakness. This period does not begin until the close on 2025-05-09.
The chart below displays the hypothetical growth of $1 invested in copper only between Trading Day of the Year #91 and TDY #122.
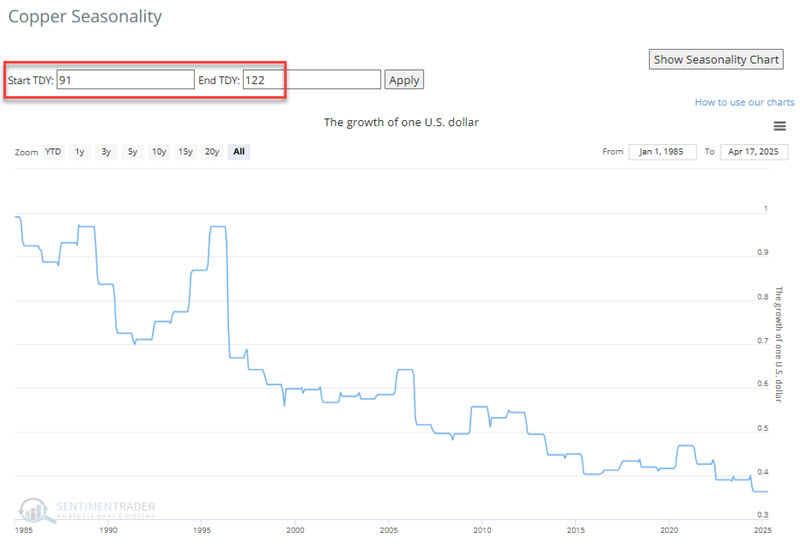
As we see in the chart above, while there are no guarantees on a year-by-year basis, the price of copper has lost over 60% during this period in the last forty years.
The chart below shows that copper has retaken its 70-day exponential moving average. A drop below that level during the unfavorable seasonal period above would be a significant warning sign for copper bulls and mark a potential opportunity for copper bears.
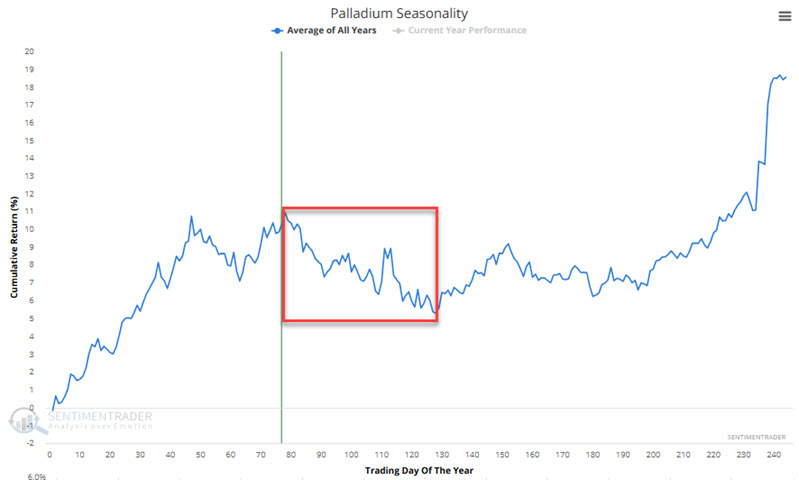
The long side of Palladium may best be avoided for a while
The chart below displays the annual seasonal trend for palladium futures. The red box highlights the period from TDY #78 through TDY #128 as a period of typical weakness. This period starts at the close on 2025-04-21.
The chart below displays the hypothetical growth of $1 invested in palladium only between Trading Day of the Year #78 and TDY #128.
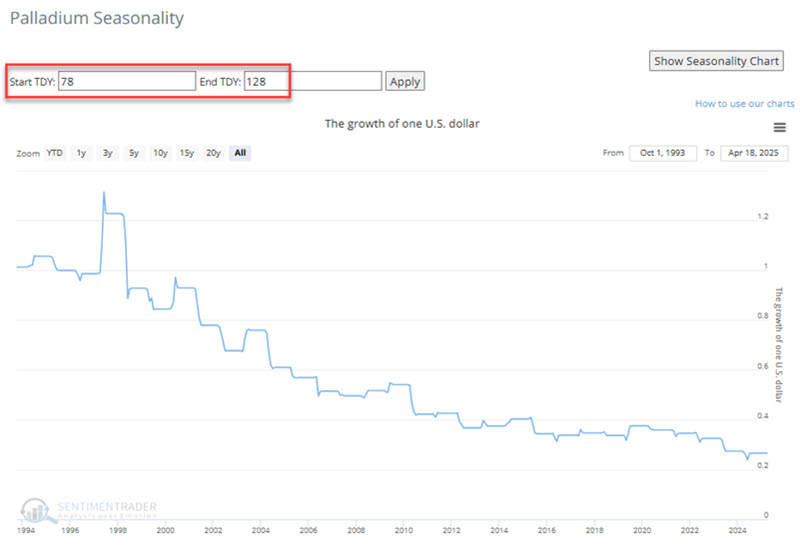
Playing the short side of palladium entails significant risk, whether selling short palladium futures contracts or shorting shares of ticker PALL, a relatively lightly traded ETF. Beyond that, based on the consistently "upper left to lower right" nature of the equity curve in the chart above, the real message is that the months ahead may be an excellent time to steer clear of a long position in either palladium futures or PALL.
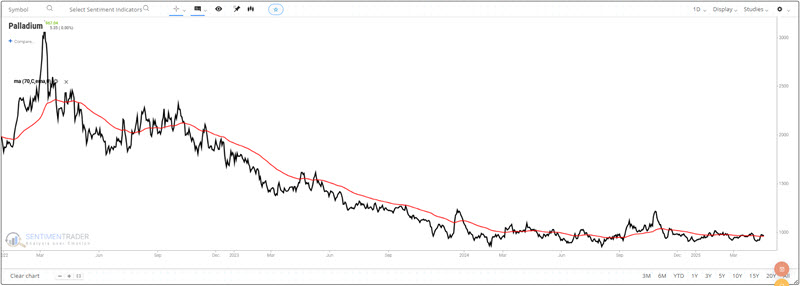
The chart below shows that palladium has been trading in a relatively narrow range for over a year. Traders will want to watch closely for a breakout in either direction. For now, however, seasonality suggests focusing on the short side of this market.
Seasonality suggests limited upside for Platinum
The chart below displays the annual seasonal trend for platinum futures. The red box highlights the period from TDY #78 through TDY #128. Note that the seasonal chart is essentially neutral for another month or so, before a significant downside bias. This period starts at the close on 2025-04-21.
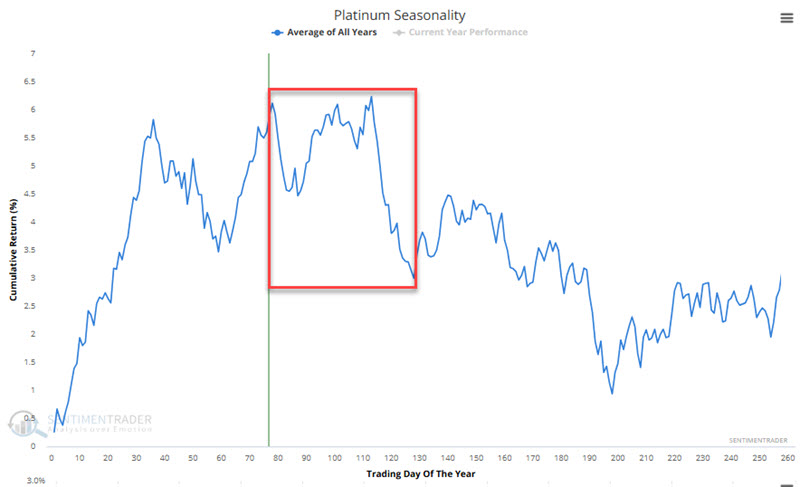
Nevertheless, given the seasonal chart above's lack of upside for the next several weeks, the chart below displays the hypothetical growth of $1 invested in platinum only between Trading Day of the Year #78 and TDY #128.
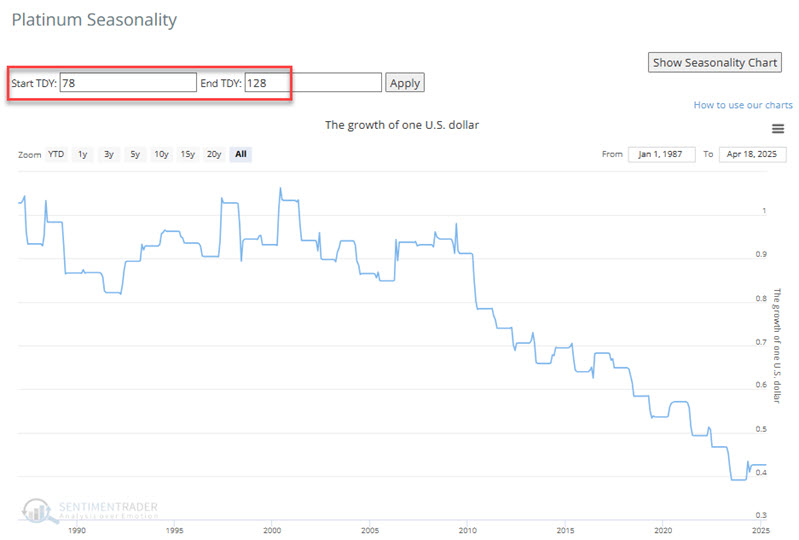
Once again, the secondary message is that there may be an opportunity to play the short side in the months ahead. However, the primary message is that traders have good reasons to avoid the long side of platinum for a while.
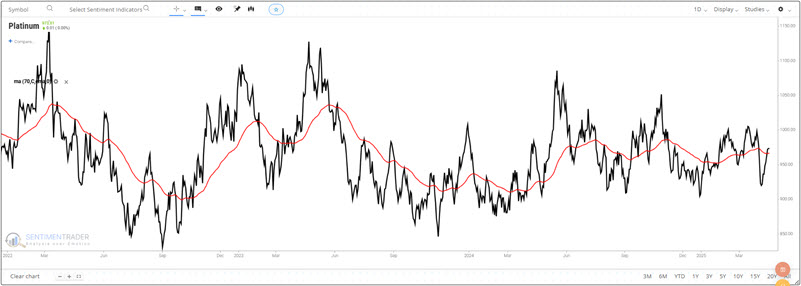
The chart below shows that platinum has retaken its 70-day exponential moving average. A drop below that level during the unfavorable seasonal period above would be a significant warning sign for platinum bulls and mark a potential opportunity for platinum bears.
What the research tells us…
Trying to pick a top in a parabolic move, such as gold is presently experiencing, is typically a foolish action. The odds of successfully picking the top are low, and the risk of loss (from holding a short position in a market screaming higher) is great. So it bears repeating that no one is suggesting here that traders sell short gold at this exact moment. With that said, expecting a straight-line advance to continue forever is also a perilous proposition. The warning here is explicit:
- Gold is soaring higher and is trying to pull the other metals higher, with limited degrees of success
- When gold finally cools off, a swift and sizeable correction is to be expected
- Any weakness in gold (i.e., the leader) is likely to have an unfavorable ripple effect throughout the metals sector
- All of the markets highlighted above are entering periods of typical seasonal weakness
None of this guarantees metals sector price weakness in the months ahead, but it does alert us to the potential for a change in market character. Traders holding long positions might consider tightening trailing stops to lock in gains, and aggressive traders might look for opportunities on the short side after gold shows some sign of cooling off.