
What to expect in the homebuilders sector

Key points:
- The homebuilders' sector has a history of moving in a highly cyclical fashion
- Sitting out this sector during seasonally unfavorable periods can allow investors to avoid downside volatility
- The weakest period of the year begins in mid-September and will last until late November
Homebuilder seasonality turns negative soon
With a number of fundamental headwinds, homebuilding stocks have declined sharply this year. Seasonality suggests it could keep going.
The chart below shows the annual seasonal trend for the SPDR S&P Homebuilders ETF (XHB). The green and red boxes highlight alternating favorable and unfavorable seasonal periods, respectively.
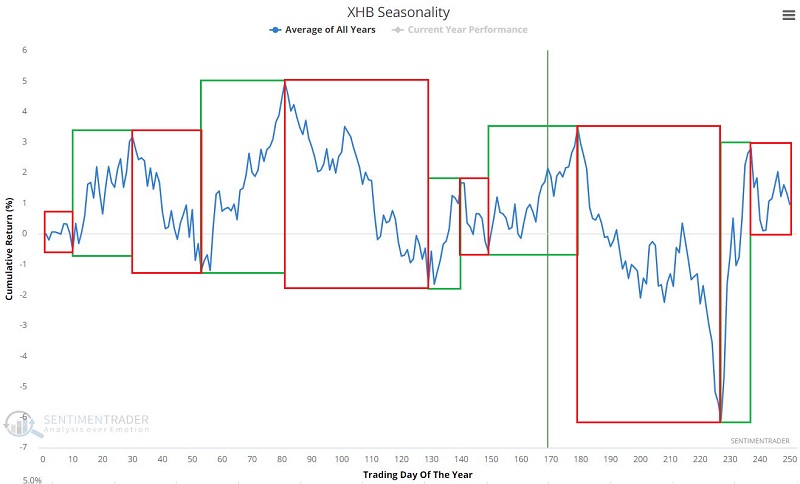
There are five favorable periods and five unfavorable periods (including an overlapping period at the end/start of each year).
To test performance, let's use XHB and compare its historical performance during favorable and unfavorable periods. Each period is referenced by its close on the "Trading Days of the Year" (TDY).
The five favorable periods for XHB are:
- TDY #10 through TDY #30
- TDY #53 through TDY #81
- TDY #131 through TDY #140
- TDY #149 through TDY #179
- TDY #227 through TDY #237
The five unfavorable periods for XHB are:
- TDY #30 through TDY #53
- TDY #81 through TDY #131
- TDY #140 through TDY #149
- TDY #179 through TDY #227
- TDY #237 through TDY #10 of the following year
The current favorable period began at the close on August 5 and ends at the close on September 19. The next unfavorable period - historically the weakest period of the year - starts then and ends on November 25.
XHB favorable periods performance
The chart below displays the hypothetical return achieved by holding XHB each year only during the favorable periods marked by green boxes in the chart above.
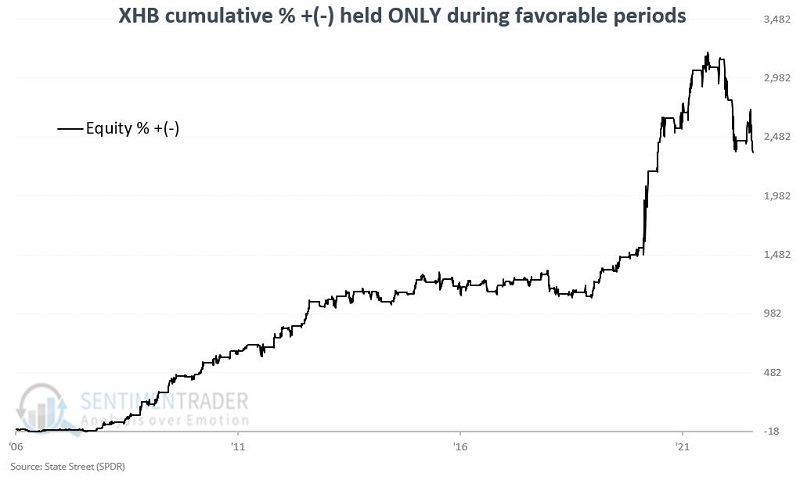
From 2006-06-03 through 2022-09-06, the cumulative gain during the green box favorable periods was +2,376% versus +55% for a buy-and-hold approach.
XHB unfavorable periods performance
The chart below displays the hypothetical return achieved by holding XHB each year only during the unfavorable periods marked by red boxes in the chart above.
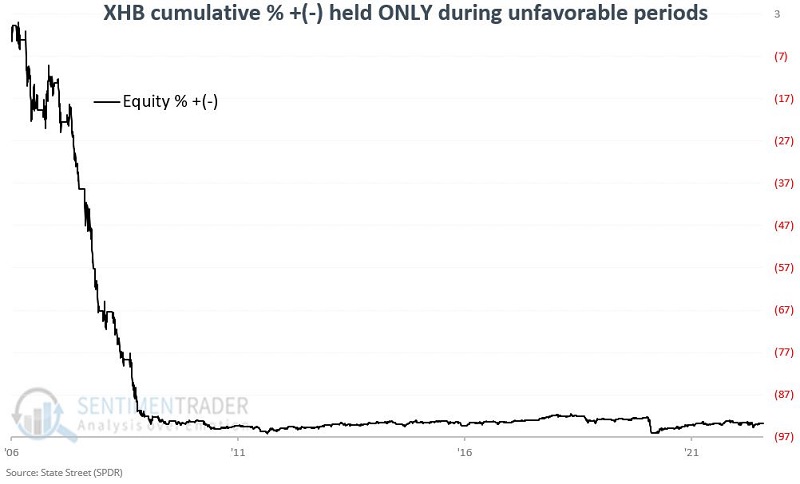
From 2006-06-03 through 2022-09-06, the cumulative loss during the red box unfavorable periods was -94% versus +55% for a buy-and-hold approach.
The 2006 through 2008 period at the far left of the chart above was disastrous and skewed the results negatively. To get a better sense of results since that time, the chart below displays the cumulative return during the red box unfavorable periods starting in January 2009 through the present.
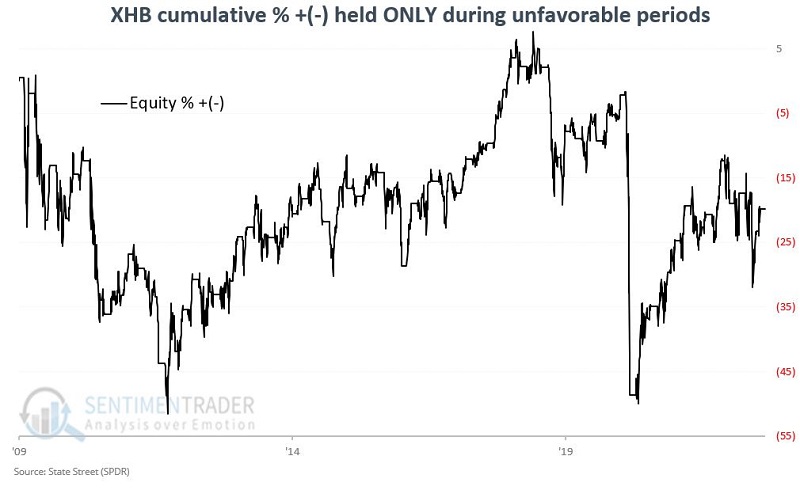
While post-2008 results are not nearly as awful as 2006-2008, an investor still could have avoided a great deal of downside volatility (and a cumulative -19.8% net loss) by not holding homebuilders during unfavorable periods post-2008.
Annual results are highly variable
It is important to note that results can vary greatly yearly.
The table below shows the hypothetical annual results for holding during favorable periods versus unfavorable periods and buy-and-hold results.
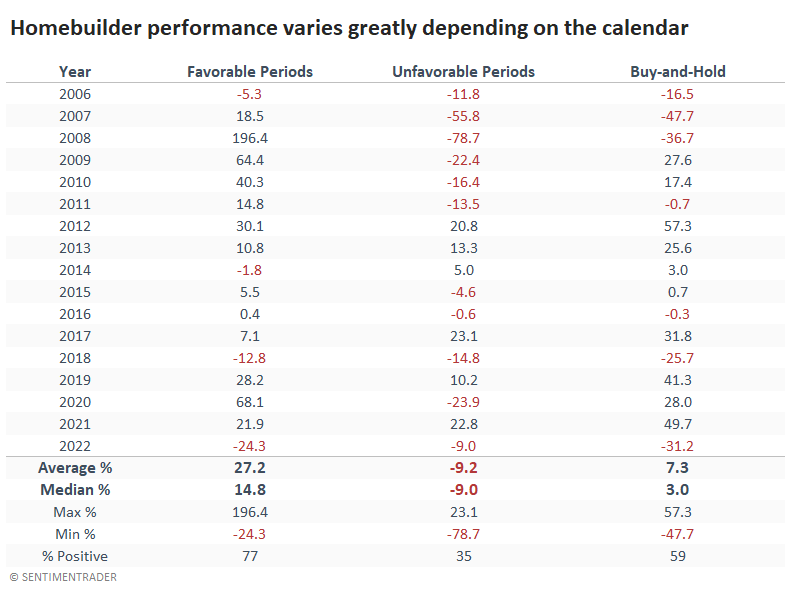
Favorable periods are having their worst year ever so far in 2022. Nevertheless, over the long-term, favorable period results have been vastly superior to unfavorable period and buy-and-hold results.
What the research tells us…
At the very least, the results above indicate that the homebuilding sector is indeed highly cyclical. Buying and holding XHB since 2006 has generated a median annual return of just 0.3%, versus a median annual return of +14.8% if held only during favorable periods.
The caveat with seasonality is always that there is no guarantee that future results will emulate those in the past. With that in mind, a trader might consider being open to holding a position in this sector if the calendar is within one of the favorable periods listed above and indicators confirm a bullish trend.