
What to expect for gas prices in the months ahead

Key points
- Unleaded gas has long tended to show strength in the first half of the year and significant weakness during the second half of the year
- Unleaded gas is entering its weakest time of year; A recent development in crude oil pricing is also flashing a warning sign
- While anything can happen, seasonality, sentiment, and (at least for the moment) price action suggest favoring the short side
Unleaded Gas price action is mixed
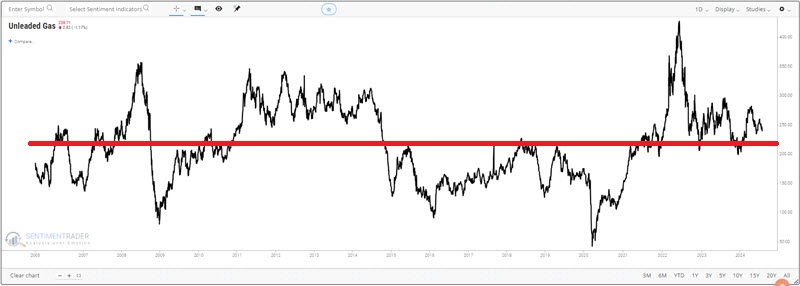
The chart below displays the price performance of unleaded gas futures since 2005. This is clearly a highly cyclical market. The average price historically has been 214 (i.e., $2.14 a gallon), and the market has spent roughly equal time above and below that price.
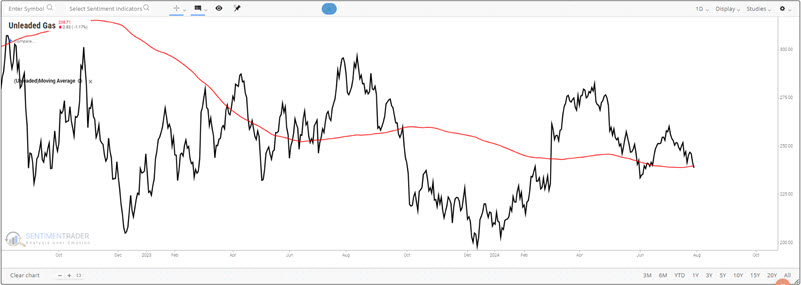
The chart below displays a more recent history of unleaded gas. To the far right, we see that the price just recently dipped back below its 200-day moving average. In recent years, prices have moved back above and below this average on many occasions.
From these charts, one might assume that there is little rhyme or reason to movement in unleaded gas price movements. But under the surface, we find something very different.
Unleaded gas is one of the most reliably cyclical markets
This article, dated 2024-06-24, made many of the points made below. Since then, unleaded gas futures rallied briefly, then declined into a downtrend. Given the current configuration, it appears worth making many of the same points again.
The chart below displays the annual seasonal trend for Unleaded Gas futures.
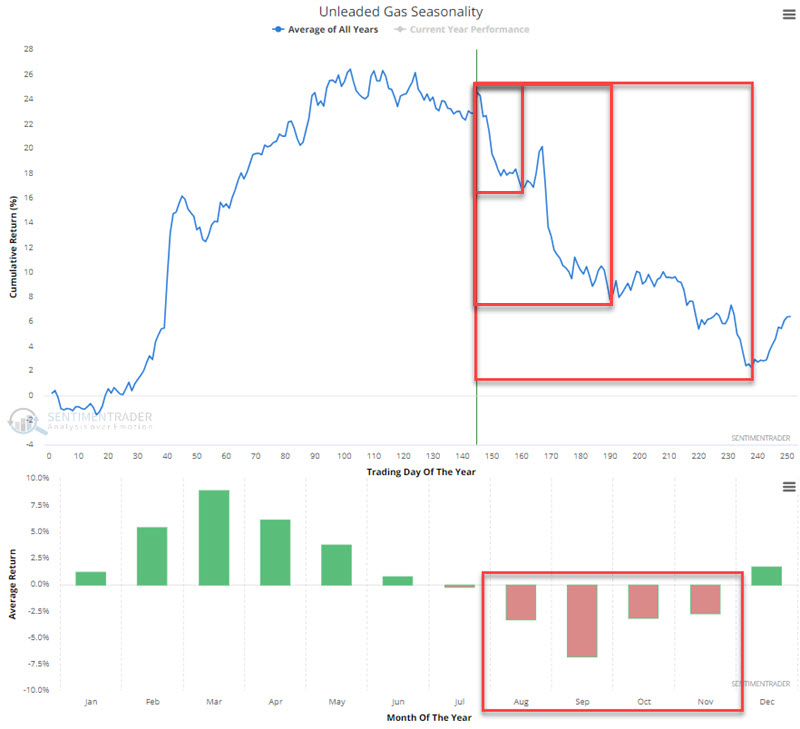
Here, we see a distinct annual pattern, which tends to show strength from December into May or June and then significant weakness in the year's second half. In the bottom clip, we see that August through November has historically averaged out to be losing months.
The top clip highlights three periods. The first extends through Trading Day of the Year (TDY) #160 (2024-08-14). The second extends through TDY #177 (2024-09-09). The largest box extends through TDY #238 (2024-12-02).
Now, for the usual caveat, seasonality is simply an average of historical performance and NOT a roadmap for what will absolutely happen in any given year.
Even with that caveat firmly in mind, the bottom line is that it typically pays to give the bullish case the benefit of the doubt early in the year and the bearish case the benefit of the doubt later in the year.
A look at different timeframes
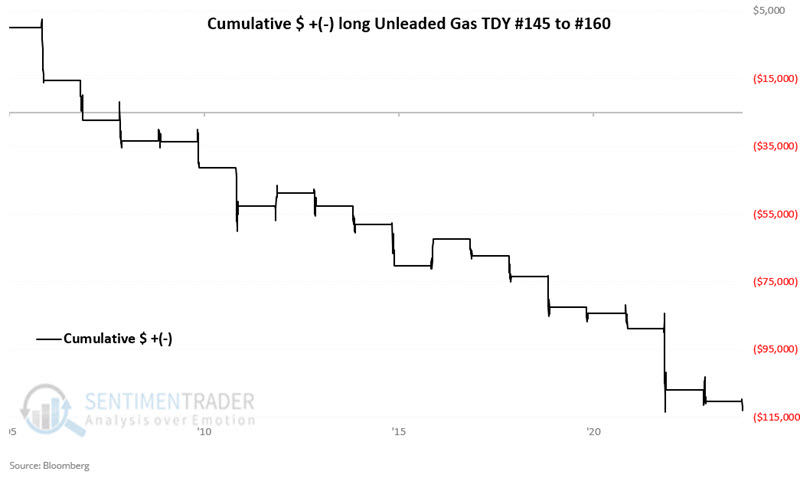
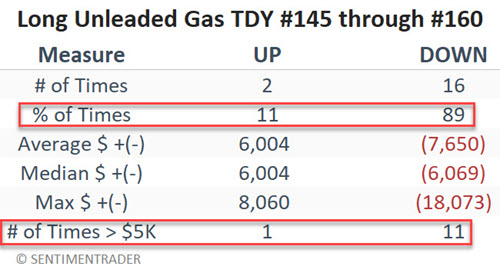
To illustrate the typical nature of unleaded gas performance during the periods highlighted above, the chart below displays the hypothetical cumulative $ +(-) achieved by holding a long position in unleaded gas futures only from TDY #145 through TDY #160 and the table below summarizes unleaded gas performance during this period.
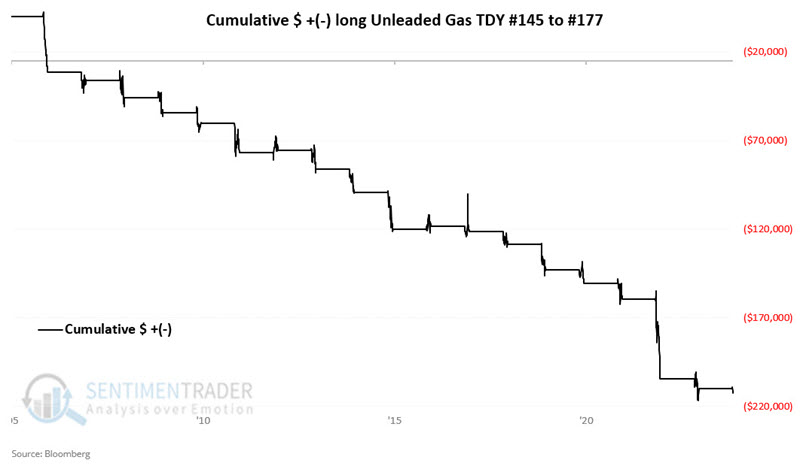
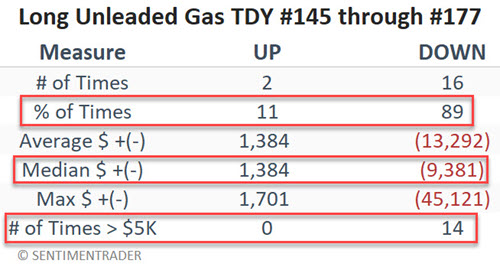
The chart below displays the hypothetical cumulative $ +(-) achieved by holding a long position in unleaded gas futures only from TDY #145 through TDY #177, and the table below summarizes unleaded gas performance during this period.
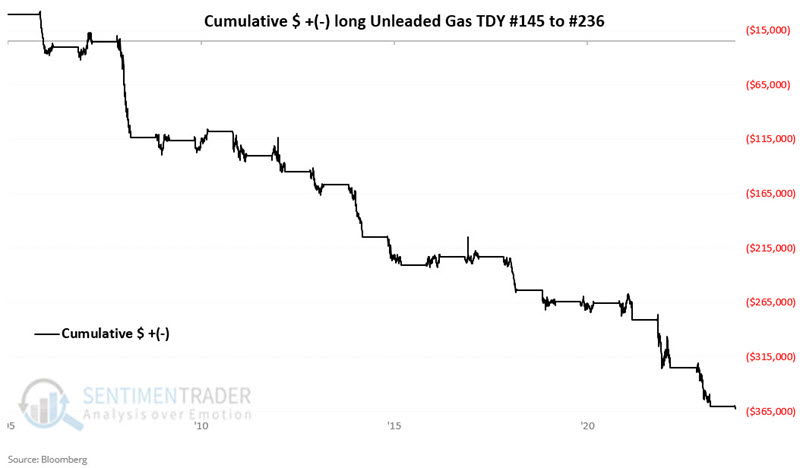
The chart below displays the hypothetical cumulative $ +(-) achieved by holding a long position in unleaded gas futures only from TDY #145 through TDY #236, and the table below summarizes unleaded gas performance during this period.
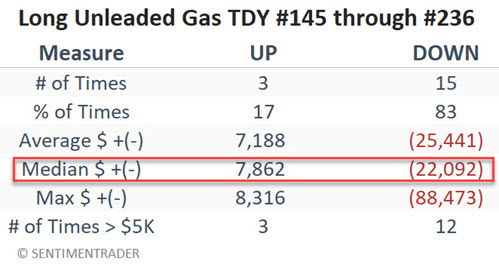
In each case, we see a significantly low Win Rate, a much more significant Median loss versus Median win, and large moves (> 5K) skewing heavily to the losing side. Could unleaded gas state a meaningful advance in the months ahead? Absolutely. However, history suggests that that is a low-probability trade and that traders are generally advised to focus on playing the short side of this volatile market.
Crude Oil Term Structure is another potential factor
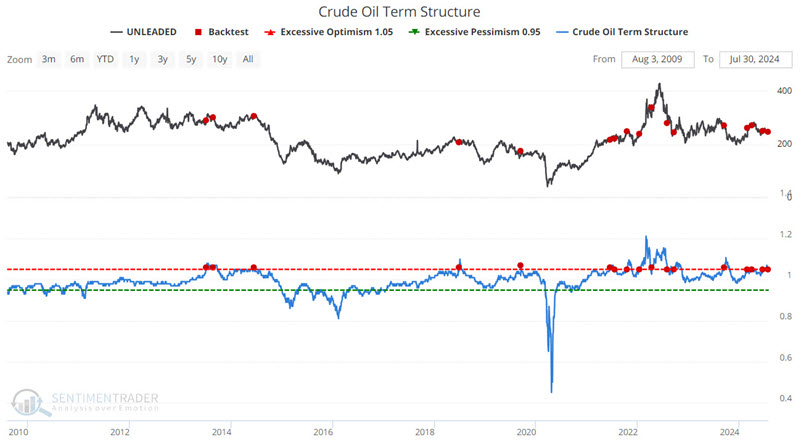
The term structure of crude oil futures shows the relationship of the near-term futures contract to a further-out contract. If it is above 1.0, then the near-term contract is priced higher than the further-out contract, called backwardation.
So, what does this have to do with unleaded gas? Crude and unleaded typically trade with a correlation of somewhere in the 80 to 85% range. So, it is not much of a stretch to suggest that what affects crude oil also affects unleaded gas. The chart below uses unleaded gas futures as the index and again shows the dates when the Crude Oil Term Structure crossed above 1.05 for the first time in 21 days in the last 15 years.
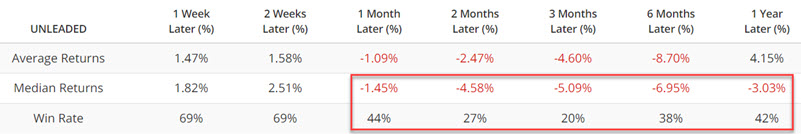
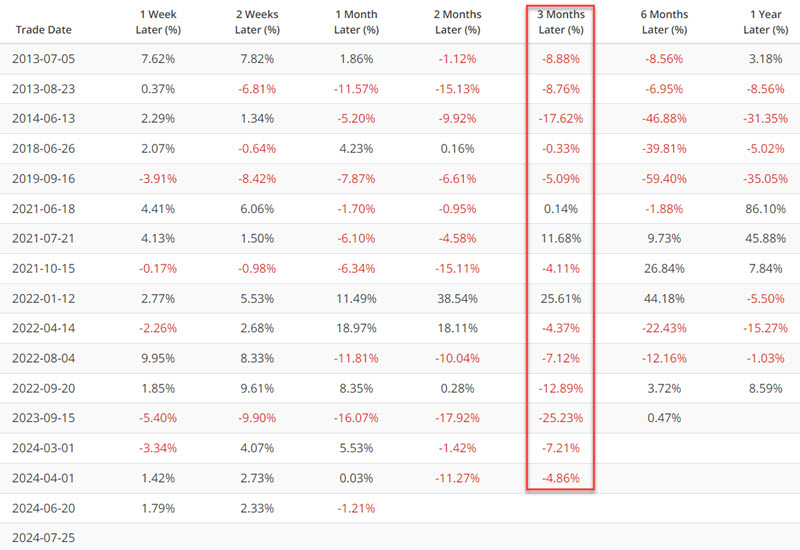
The tables below summarize unleaded gas futures performance and display signal-by-signal results. Note the typically poor performance during the two to six months after a signal.
What the research tells us…
Many factors can influence the price of unleaded gas. Any unusual shortage or surplus can cause substantial price spikes or declines. Nevertheless, given the persistently unfavorable nature of the seasonal period we are in-especially when combined with the recent unfavorable signal from our Crude Oil Term Structure indicator-aggressive, well-capitalized traders should view any price weakness as a potential opportunity to play the short side of unleaded gas futures.