
What the Spike in Gold VIX Might Mean

Key points:
- A rare signal from the Gold VIX indicator flashed recently
- That indicator has now reversed, and the resulting reversal signal may have significant implications for stocks, metals, and commodities in the year ahead
- The one huge caveat is the minuscule historical sample size; Nevertheless, the historical results are at least worthy of consideration
A spike and reversal in Gold VIX
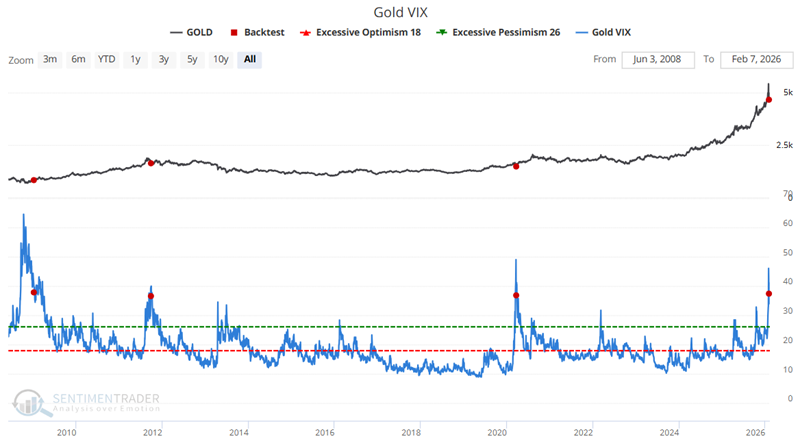
Similar to the VIX Index, which most people are familiar with and tracks traders' expectations of future volatility in the stock market based on option pricing models, our Gold VIX indicator tracks volatility expectations using options on the SPDR Gold Trust ETF (GLD).
As we discussed in this recent note, the Gold VIX indicator spiked to an extremely high level. The VIX Index crossed above 38 on January 29th and dropped back below 38 on February 2nd.
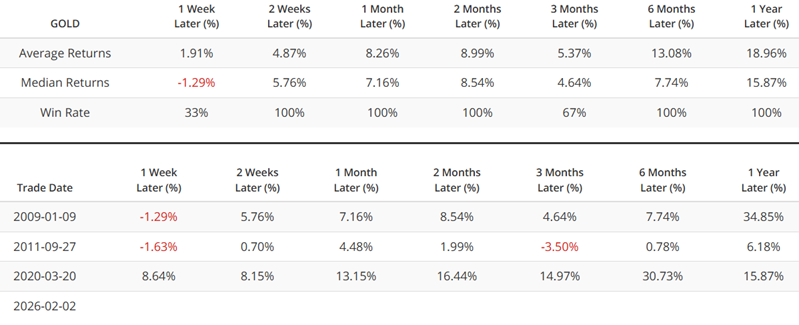
This type of reversal has occurred only three previous times since 2009. So the massive caveat to everything that follows is that small sample sizes can always be called into question and should not be trusted implicitly as a precise indication of what will happen in the future. However, the results following the three previous signals are compelling enough across enough markets to warrant a mention. Just remember that everything presented below is "Food for thought" and not "A table-pounding call to action."
Starting with Metals
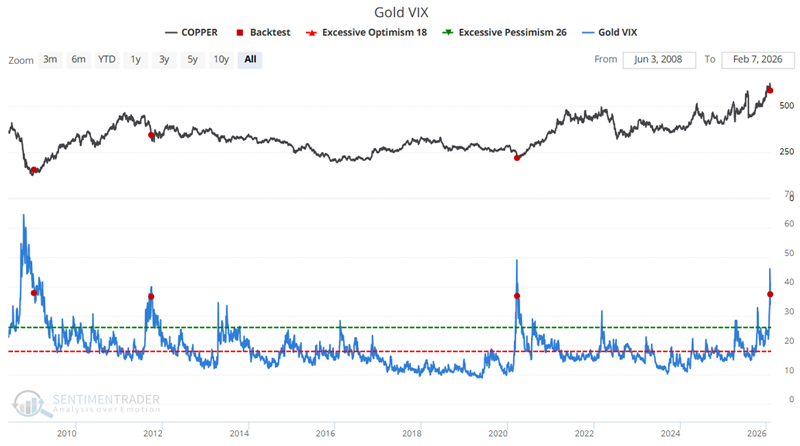
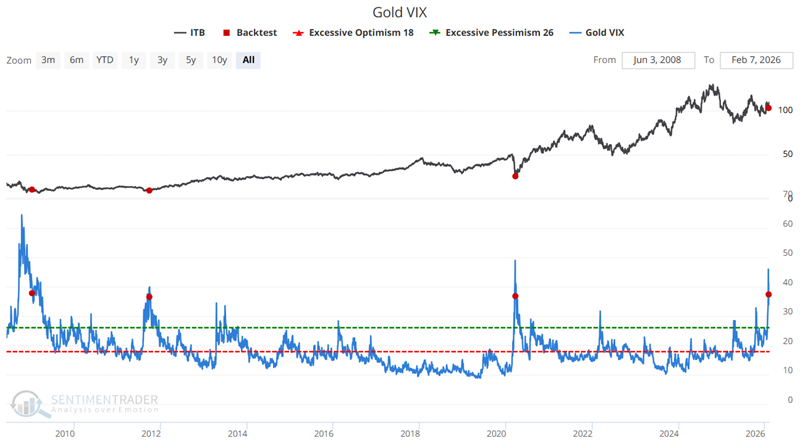
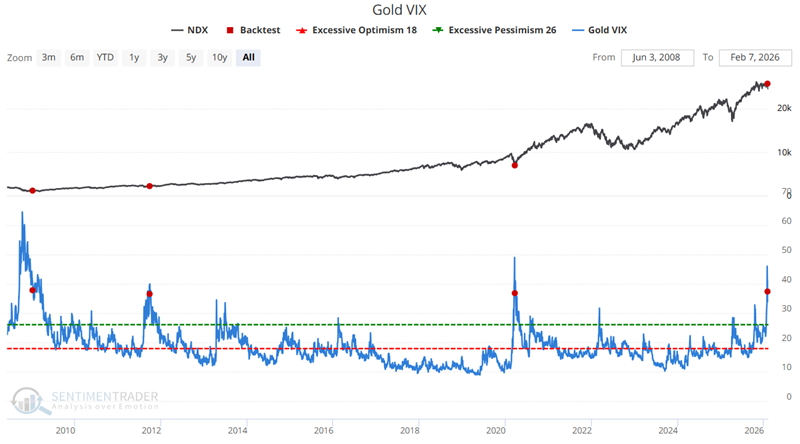
The chart below highlights, with a red dot, the rare occasions when the Gold VIX fell below 38 for the first time in three months.
The table below summarizes subsequent Gold performance following the dates highlighted above.
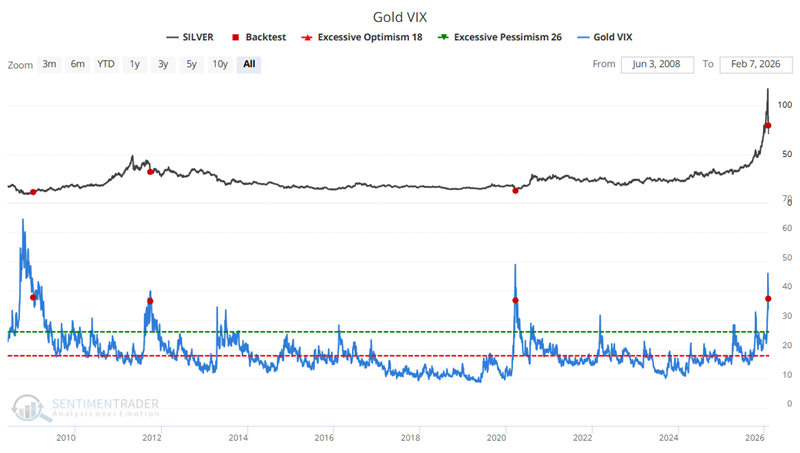
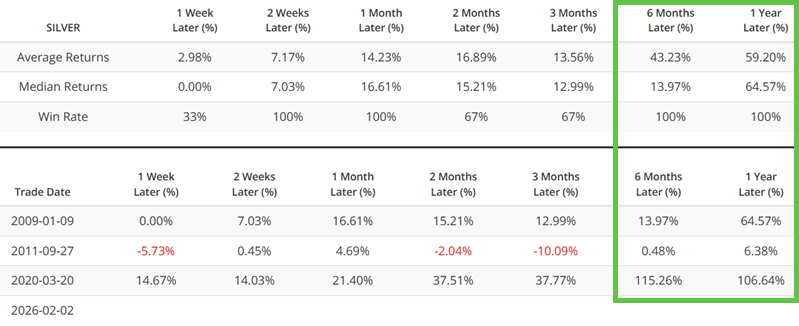
While Gold results are decent, Silver and Copper really, um, shine, as seen below. First, Silver results.
Next up is Copper.
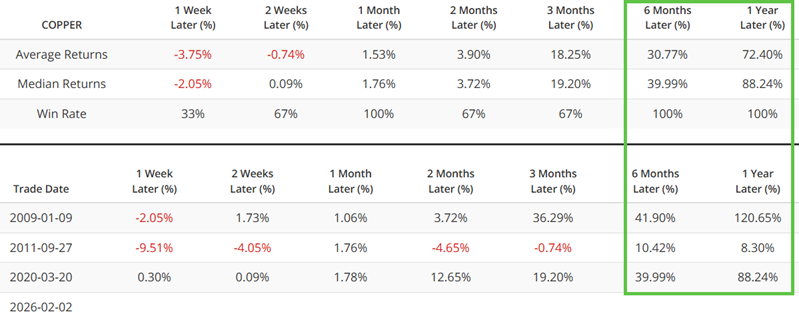
As I said, the historical results - to the limited extent that they exist - are compelling. However, the worst mistake a trader could make would be to decide to load up on Silver or Copper based on the assumption that the next twelve months will resemble the historical results above. A better approach might be to give these markets the bullish benefit of the doubt as long as they act well.
A handful of performances of note
To repeat, you'll need to take all of the results shown in this note with a grain of salt due to the small sample size. That said, let's highlight a few eye-popping performances following previous Gold VIX signals.
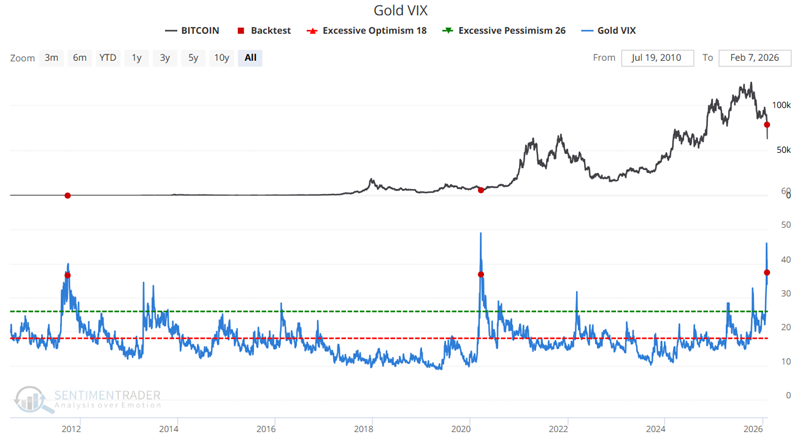
Given its price history, it should come as no surprise that Bitcoin showed some eye-popping results; however, its history encompasses only two of the three previous signals. So the recent Gold VIX signal should not be viewed as any "automatic" buy signal for Bitcoin, particularly given Bitcoin's current price downtrend.
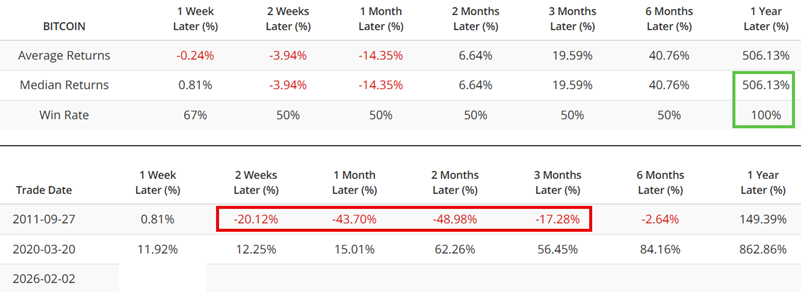
When setting expectations, be sure to note the -49% decline Bitcoin suffered over two months after the September 2011 signal (which, wildly, turned into a 149% gain ten months later).
There is no clear explanation for why the Homebuilder sector would be a top performer following a Gold VIX signal (nor should any assumption be made that it will remain so in the future). Still, the results are what they are, as shown below.
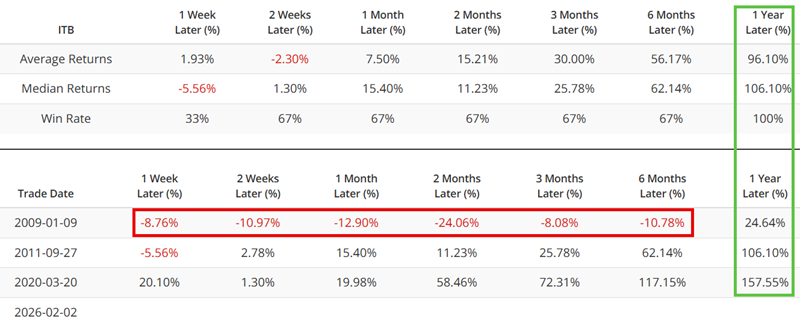
Once again, it is worth noting that the first several months following the January 2009 signal witnessed a near-waterfall decline before price action finally reversed higher.
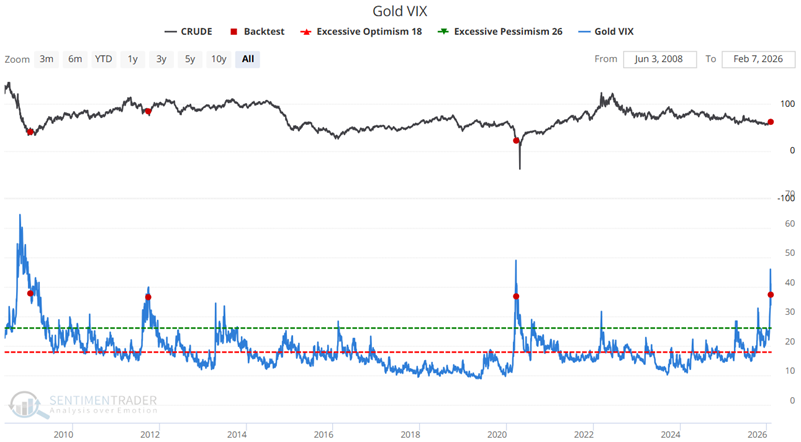
For those looking at commodities, Crude Oil's performance stands out.
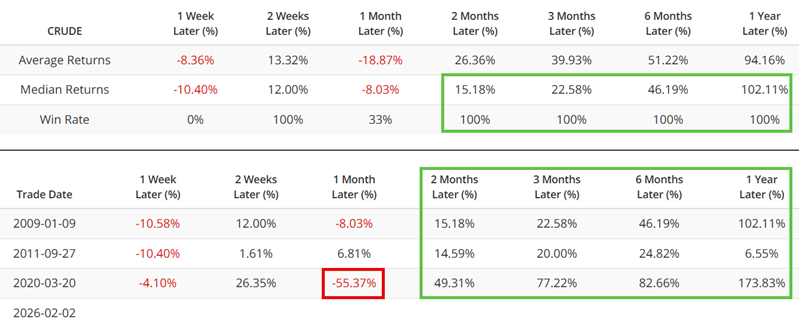
Here we go again. The first instinct for many inexperienced traders might be to look at a 100% Win Rate and a Median 12-month return of 102% and think, "I can jump in." But a) remember that the sample size is too small to draw conclusions from, and b) note the -55% decline in one month following the March 2020 signal before assuming there is any "easy money" to be made.
Again, this reminds us to look at the Gold VIX signal as the "weight of the evidence," which might lead us to give a market like crude oil the benefit of the doubt in the year ahead. But under no circumstances should we "buy and steadfastly hold on" based solely on this signal.
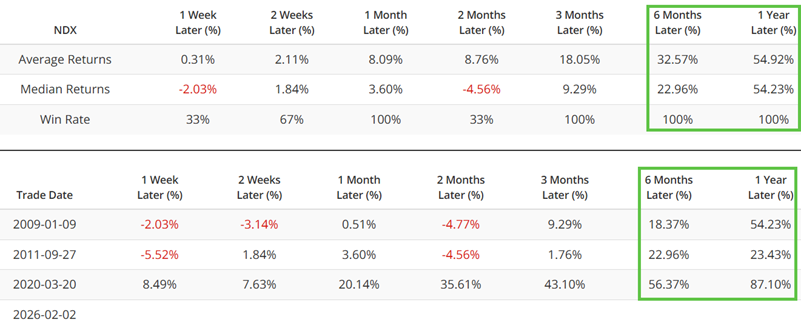
For those looking at stocks, the Nasdaq 100 Index has performed well following prior signals.
A look across a variety of markets and sectors
The table below summarizes results across a wide variety of markets, indexes, and ETFs. By clicking on the market name in blue under the far-right-hand side "Link" column, you can launch the test for that particular asset and review the results for yourself.
| Market | Period | Median % +(-) | Win Rate % | Link |
| Bitcoin | 12 mos | 506.1 | 100 | Bitcoin |
| ITB | 12 mos | 106.1 | 100 | ITB |
| Crude Oil | 12 mos | 102.1 | 100 | Crude Oil |
| Unleaded Gas | 12 mos | 92.8 | 100 | Unleaded Gas |
| Copper | 12 mos | 88.2 | 100 | Copper |
| EEM | 12 mos | 71.9 | 100 | EEM |
| SMH | 12 mos | 62.2 | 100 | SMH |
| NDX | 12 mos | 54.2 | 100 | NDX |
| GDX | 12 mos | 60.2 | 67 | GDX |
| Platinum | 12 mos | 60.2 | 100 | Platinum |
| XLB | 12 mos | 48.8 | 100 | XLB |
| XLK | 12 mos | 47.6 | 100 | XLK |
| XBI | 12 mos | 47.4 | 100 | XBI |
| RSP | 12 mos | 45.9 | 100 | RSP |
| Silver | 12 mos | 64.6 | 100 | Silver |
| VEU | 12 mos | 43.4 | 100 | VEU |
| BCOMSP | 12 mos | 42.9 | 100 | BCOMSP |
| XLY | 12 mos | 41.3 | 100 | XLY |
| IWF | 12 mos | 36.9 | 100 | IWF |
| IYR | 12 mos | 35.2 | 100 | IYR |
| RUT | 12 mos | 33.8 | 100 | RUT |
| EFA | 12 mos | 32.7 | 100 | EFA |
| XLF | 12 mos | 31.8 | 100 | XLF |
| MXWO | 12 mos | 30.9 | 100 | MXWO |
| IWB | 12 mos | 30.4 | 100 | IWB |
| SPX | 12 mos | 28.8 | 100 | SPX |
| XLI | 12 mos | 27.3 | 100 | XLI |
| XLE | 12 mos | 23.8 | 100 | XLE |
| IYT | 12 mos | 23.7 | 100 | IYT |
| XLV | 12 mos | 23.3 | 100 | XLV |
| JNK | 12 mos | 22.4 | 100 | JNK |
| Palladium | 6 mos | 21.7 | 100 | Palladium |
| XLP | 12 mos | 18.4 | 100 | XLP |
| Gold | 12 mos | 15.9 | 100 | Gold |
| XLU | 12 mos | 7.6 | 100 | XLU |
| Dollar | 12 mos | (6.8) | 33 | Dollar |
| Coffee | 3 mos | (7.5) | 0 | Coffee |
| Thirty | 12 mos | (12.3) | 33 | Thirty |
What the research tells us...
The results detailed above tell us some things but not others. On a few rare occasions over the past two decades, the Gold VIX indicator has spiked above 38 and then crossed back below it. On those rare occasions, a wide variety of markets - stock indexes, stock sectors, metals, miners, energy, and some others have reacted violently following that particular sequence of events. What this history suggests is that we should be prepared for extreme price movements going forward. What this history does NOT do is guarantee that the year ahead will look anything like the history detailed above. Drawing conclusions and acting definitively based solely on an indicator signal with a sample size of three is extremely dangerous. Likely the best real-world advice is to a) not let the returns displayed above put stars in your eyes, and b) look for price action to confirm any of the historical trends shown above before risking capital based on this signal.