Data &
Technology
Research
Reports
Report Solutions
Reports Library
Actionable
Strategies
Free
Resources
Simple Backtest Calculator
Simple Seasonality Calculator
The Kelly Criterion Calculator
Sentiment Geo Map
Public Research Reports
Free Webinar
Pricing
Company
About
Meet Our Team
In the News
Testimonials
Client Success Stories
Contact
Log inLoginSign up
< BACK TO ALL REPORTS

What the "day after" means

Jason Goepfert
2020-11-05
Stocks jumped the day after the presidential election, and that's been a good sign for the next few months.

One day doesn't make a trend. Usually.

That's a pretty sound principle, as we often one-day reactions reversed going forward, especially surrounding major events. Turns out that hasn't been the case so much with presidential elections.

The table below shows forward returns in the S&P 500 after it rallied in relief the day after an election.

S&P when rallying on presidential election day

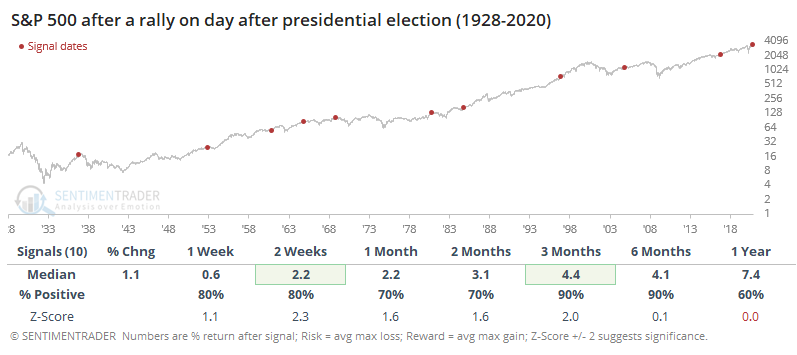
The returns in the table are as of the day after, so it indicates further gains, not including the gain on the day after. It was impressively consistent, with only a single loss 3 months later, and a positively skewed risk/reward ratio. All of the individual signals showed only minor losses, if any, on all time frames up to 6 months later.

These results differed significantly from those years when investors showed initial disappointment in the returns.

It's always questionable to extrapolate very short-term movements to longer-term returns. With that warning, these results should give a little comfort to bulls.


What else is happening

These are topics we explored in our most recent research. For immediate access with no obligation, sign up for a 30-day free trial now.

  • All signals showing when stocks rallied after an election (and when it didn't)
  • Internal momentum in the Nasdaq 100 and broader tech sector is turning positive again

Stat Box

Thanks to small-cap stock weakness, breadth on the NYSE was tepid on Wednesday. That session marked the only time in history when the S&P 500 rose more than 2% and yet there was more volume in declining securities than advancing ones. There were 5 times the S&P rose 1% or more with more declining than advancing volume, and the index fell over the next 2 months every time. These results should be taken with a grain of salt given the election machinations.

Sentiment from other perspectives

We don't necessarily agree with everything posted here - some of our work might directly contradict it - but it's often worth knowing what others are watching.

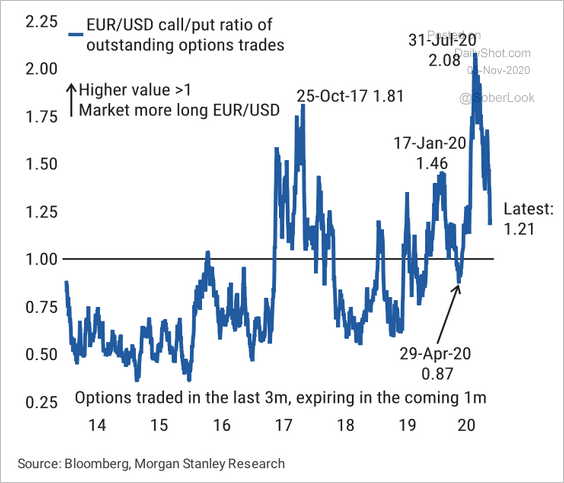
1. Options traders had a 6-year high in outstanding bets on the euro in July, and it's now coming back to neutral - Daily Shot

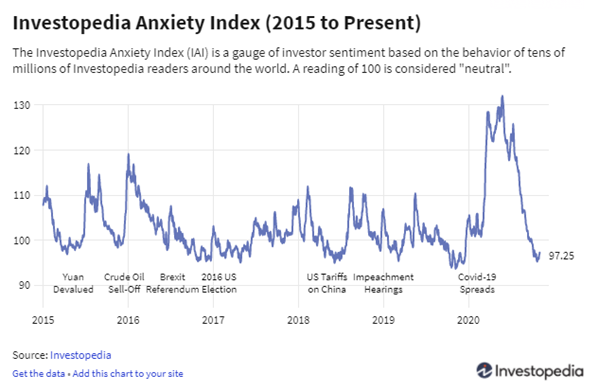
2. Investors are searching for less anxious-y things on Investopedia - Investopedia

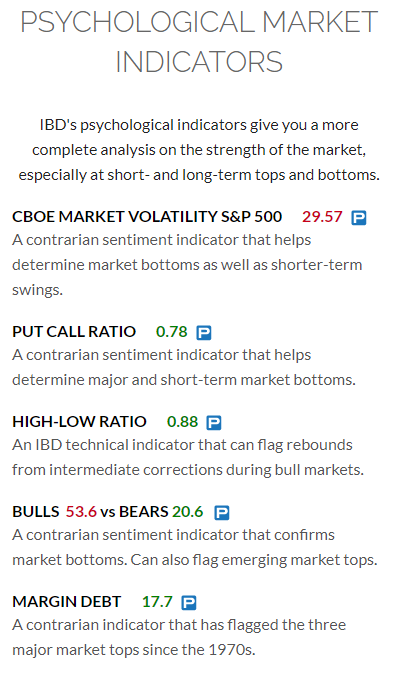
3. A handful of sentiment indicators are still showing quite a bit of optimism - IBD

DATA &
TECHnologies
IndicatorEdge
‍
BackTestEdge
‍
Other Tools
‍
DataEdge API
RESEARCH
reports
Research Solution
‍
Reports Library
‍
actionable
Strategies
Trading Strategies
‍
Smart Stock Scanner
‍
FREE
RESOUrCES
Simple Backtest
Calculator
Simple Seasonality
Calculator
The Kelly Criterion
Calculator
Sentiment Geo Map
‍
Public Research Reports
‍
Free Webinar
COMPANY
‍
About
‍
Meet our Team
‍
In the News
‍
Testimonials
‍
Client Success Stories
Pricing
Bundle pricing
‍
Announcements
‍
FAQ
© 2024 Sundial Capital Research Inc. All rights reserved.
Setsail Marketing
TermsPrivacyAffiliate Program
Risk Disclosure: Futures and forex trading contains substantial risk and is not for every investor. An investor could potentially lose all or more than the initial investment. Risk capital is money that can be lost without jeopardizing ones’ financial security or life style. Only risk capital should be used for trading and only those with sufficient risk capital should consider trading. Past performance is not necessarily indicative of future results.

Hypothetical Performance Disclosure: Hypothetical performance results have many inherent limitations, some of which are described below. No representation is being made that any account will or is likely to achieve profits or losses similar to those shown; in fact, there are frequently sharp differences between hypothetical performance results and the actual results subsequently achieved by any particular trading program. One of the limitations of hypothetical performance results is that they are generally prepared with the benefit of hindsight. In addition, hypothetical trading does not involve financial risk, and no hypothetical trading record can completely account for the impact of financial risk of actual trading. for example, the ability to withstand losses or to adhere to a particular trading program in spite of trading losses are material points which can also adversely affect actual trading results. There are numerous other factors related to the markets in general or to the implementation of any specific trading program which cannot be fully accounted for in the preparation of hypothetical performance results and all which can adversely affect trading results.

Testimonial Disclosure: Testimonials appearing on this website may not be representative of other clients or customers and is not a guarantee of future performance or success.