Products
SentimenTrader Trading Tools
‍
Backtest Engine
My Trading Toolkit
Correlation Analysis
Seasonality
Market Prediction
Indicators & Data API
‍
Proprietary Indicators & Charts
Market Data API
Strategies & Scanner
‍
50+ Trading Strategies
Smart Stock Scanner
Smart Option Scanner
Research Reports
‍
Research Solutions
Reports Library
Free Resources
Simple Backtest Calculator
Simple Seasonality Calculator
The Kelly Criterion Calculator
Sentiment Geo Map
Public Research Reports
Education
Sentiment Indicators
Technical Indicators
Pricing
Company
About
In the News
Testimonials
Client Success Stories
Contact
Log inLoginSign up
< BACK TO ALL REPORTS

What the credit market is telling stock investors

Jason Goepfert
2021-03-24
The spread on the lowest-rated corporate bonds is rising faster than the highest-rated ones, a sign of anxiety among credit investors.

Much of the rally in assets over the past few months seems to have been driven by ever-easier financial conditions. Only lately have those conditions started to tighten.

Part of this is due to changes within the bond market. We're just now seeing the spread between the lowest-rated investment-grade corporate bonds rising faster than that of the highest-rated bonds. This suggests that credit investors are starting to get just a bit nervous.

Generally, we can assume that when the spread between lower-quality and high-quality bonds is rising, it's during times of rising anxiety. The chart below shows this clearly (note that the scale on the spread is inverted).

BBB - AAA option adjusted bond spread

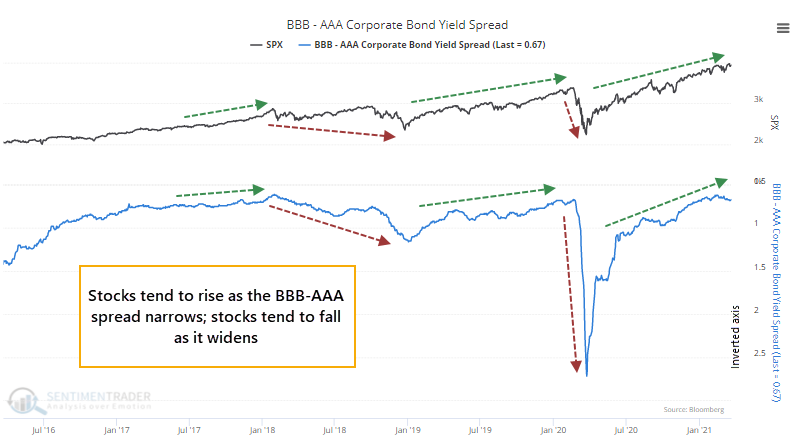
For the first time in almost a year, spreads on riskier bonds are starting to rise compared to spreads on the safest ones. It had been more than 200 days since the 50-day average of the spread was rising, ending the 3rd-longest streak in 25 years.

What else we're looking at

  • Full returns in stocks, gold, and Treasuries when the corporate yield spread starts to turn
  • What happens when the euro cross below its long-term average
  • Small-cap stocks just ended their 14th-longest streak above their medium-term moving average
  • The VIX recent got smacked - the day of the week tends to matter
  • The TLT bond fund shows a very consistent calendar quirk

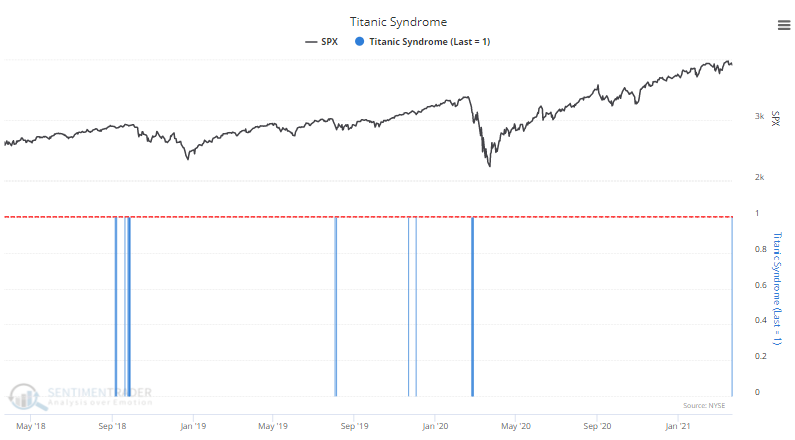
Stat Box

Stocks triggered a Titanic Syndrome technical warning on Tuesday. According to our Backtest Engine, even a single warning has preceded an average return of -0.65% in the S&P 500 over the next couple of weeks since 1965.


Etcetera

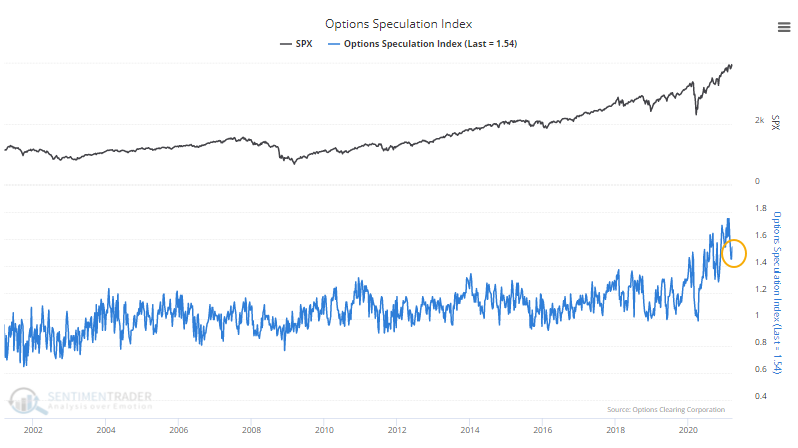
Speculation is ebbing. Bloomberg notes that call option volumes have dropped off as speculative activity eases along with stock price declines. But it's also worth noting that overall speculative options activity is STILL more than 10% - 15% higher than any other period in the past 20 years.

options speculation index

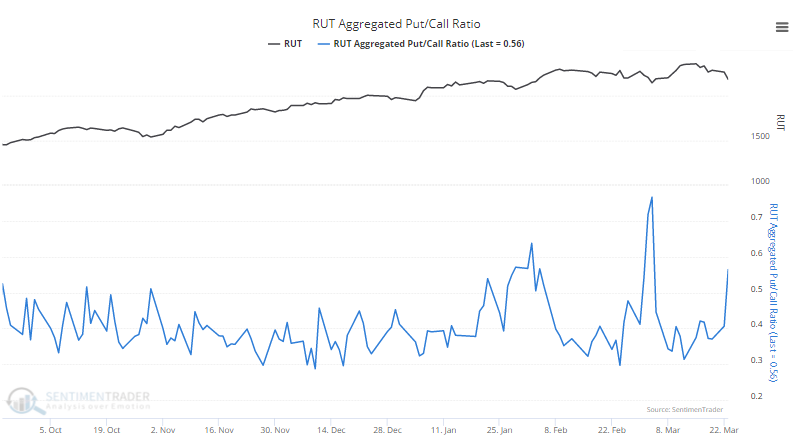
Buying a few more puts. Options traders showed a bit of fear on Tuesday with the big drop in small-cap stocks, as the put/call ratio among member stocks in the Russell 2000 index jumped to its 3rd-highest level in 6 months.

russell 2000 put call ratio

Technical warning. When stocks were recently at a 52-week high, then there is a surge of 52-week lows among securities on the NYSE, it triggers a Titanic Syndrome warning sign. That happened on Tuesday.

titanic syndrome

PRODUCTS
SentimenTrader
Trading Tools
Indicators & Data API
‍
Strategies & Scanner
‍
Research Reports
FREE
RESOUrCES
Simple Backtest
Calculator
Simple Seasonality
Calculator
The Kelly Criterion
Calculator
Sentiment Geo Map
‍
Public Research Reports
‍
Education
Sentiment Indicators
‍
Technical Indicators
‍
Pricing
Bundle pricing
‍
FAQ
‍
Announcements
‍
COMPANY
‍
About
‍
In the News
‍
Testimonials
‍
Client Success Stories
CONTACT
‍
General Inquiries
‍
Media Inquiries
‍
Financial Professionals Inquiries
‍
© 2026 Sundial Capital Research Inc. All rights reserved.
Setsail Marketing
TermsPrivacyAffiliate Program
Risk Disclosure: The information and tools provided are for research and analytical purposes only and are not intended as investment advice. Market analysis involves uncertainty, and outcomes may differ from expectations. Users should conduct their own due diligence and consider their individual circumstances before making any financial decisions. Past performance is not necessarily indicative of future results.

Hypothetical Performance Disclosure: Hypothetical performance results have many inherent limitations, some of which are described below. No representation is being made that any account will or is likely to achieve profits or losses similar to those shown; in fact, there are frequently sharp differences between hypothetical performance results and the actual results subsequently achieved by any particular trading program. One of the limitations of hypothetical performance results is that they are generally prepared with the benefit of hindsight. In addition, hypothetical trading does not involve financial risk, and no hypothetical trading record can completely account for the impact of financial risk of actual trading. for example, the ability to withstand losses or to adhere to a particular trading program in spite of trading losses are material points which can also adversely affect actual trading results. There are numerous other factors related to the markets in general or to the implementation of any specific trading program which cannot be fully accounted for in the preparation of hypothetical performance results and all which can adversely affect trading results.

Testimonial Disclosure: Testimonials appearing on this website may not be representative of other clients or customers and is not a guarantee of future performance or success.