
What Q1 Performance Means - and Does Not Mean - for the Rest of the Year

Key points:
- Since 1950, the S&P 500 has shown a first-quarter gain 62% of the time
- Following positive Q1s the index showed a positive Q2+Q3 performance 77% of the time versus 46% following negative Q1s
- Following positive Q1s the index showed a positive "Last 9 months of the year" performance 80% of the time versus 50% following negative Q1s
- While the decline for the S&P 500 during the first three months of the year does not guarantee an impending bear market, it does suggest that investors adjust their expectations for the remainder of 2026
Q1 closed with a loss for the S&P 500
The S&P 500 index lost -4.4% during the first quarter of 2026. This is well below the average. A summary of the 1st quarter S&P 500 performance since 1950 appears in the table below. We can see that in the past 77 years, Q1 ended with a gain 62% of the time.
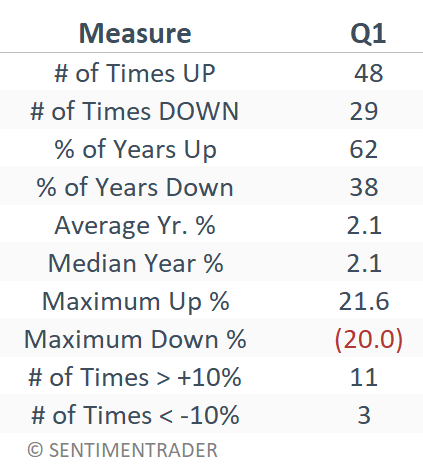
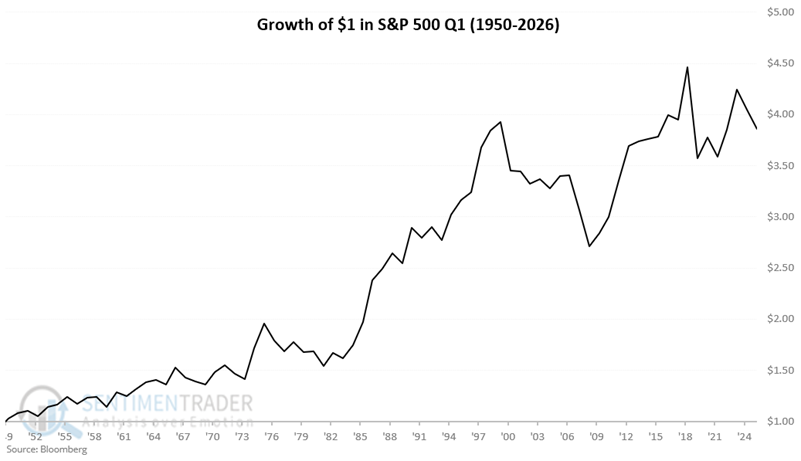
The chart below shows the hypothetical growth of $1 invested in the S&P 500 only in January, February, and March each year, starting in 1950. $1 grew to $3.86.
The real question here is "Does the performance for the 1st quarter offer any insights into the likely performance for the rest of the year?" Let's talk about that next.
The fourth quarter of the year has a strong historical tendency to show a gain. So, we will break down performance as follows:
- 2nd and 3rd quarter performance
- 4th quarter performance
- "Rest of Year" (i.e., the last 9 months of the year, or the two above periods combined) performance
Quarters 2 and 3 based on S&P 500 Q1 performance
The table below summarizes S&P 500 performance in Q2 and Q3 combined (i.e., April 1st through September 30th) based on whether the index gained or lost in the first quarter of the year.
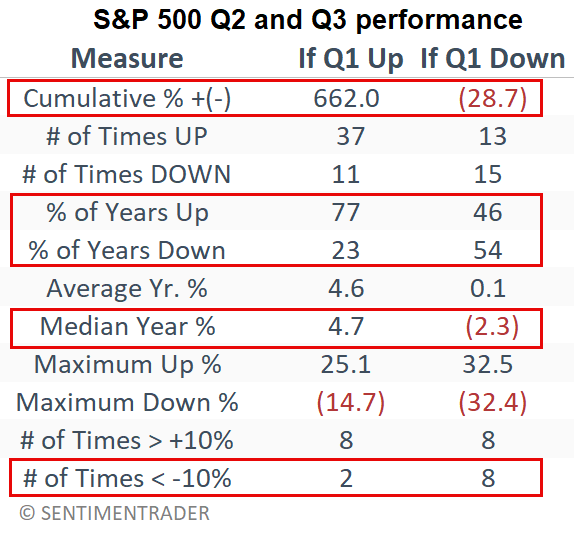
Can we say that a down Q1 is "bearish" for stocks during Q2 and Q3? That might be a stretch, as the S&P 500 showed a Q2+Q3 gain 46% of the time after a down Q1. But the odds of good performance increase after an UP Q1 and decrease after a DOWN Q1.
If Q1 was up:
- Q2+Q3 was up 77% of the time versus 46% of the time if Q1 was down
- Q2+Q3 showed a median gain of 4.7% versus -2.3% if Q1 was down
- Q2+Q3 lost more than -10% two times versus eight times if Q1 was down
The chart below shows the hypothetical growth of $1 in the S&P 500 during Q2 and Q3 only during years when Q1 showed a gain. $1 grew to $7.62.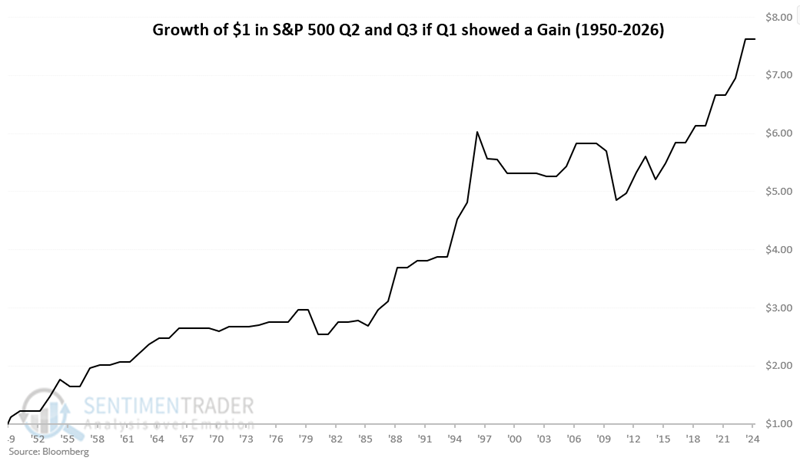
The chart below shows the hypothetical growth of $1 in the S&P 500 during Q2 and Q3 only during years when Q1 showed a loss. $1 declined to $0.71.
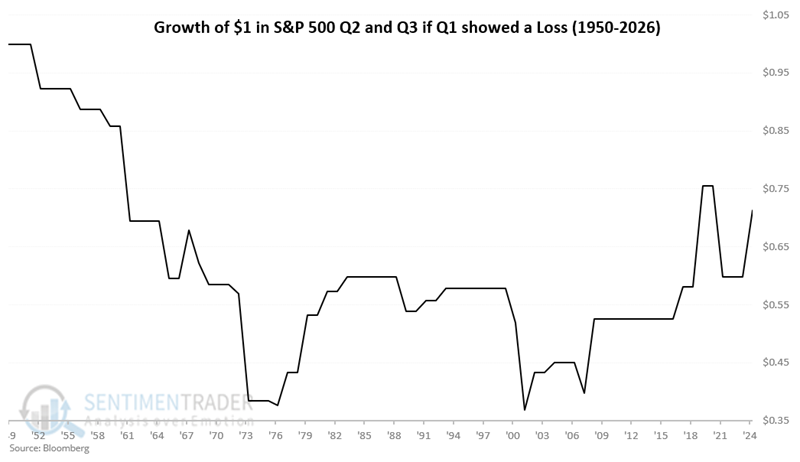
Again, we cannot definitively state that a Q1 gain will be bullish or that a Q1 loss will be bullish. But a historical bias appears evident.
S&P 500 4th Quarter performance based on S&P 500 Q1 performance
The table below summarizes S&P 500 performance in Q4 (i.e., October 1st through December 31st) by whether the index gained or lost in the first quarter of the year.
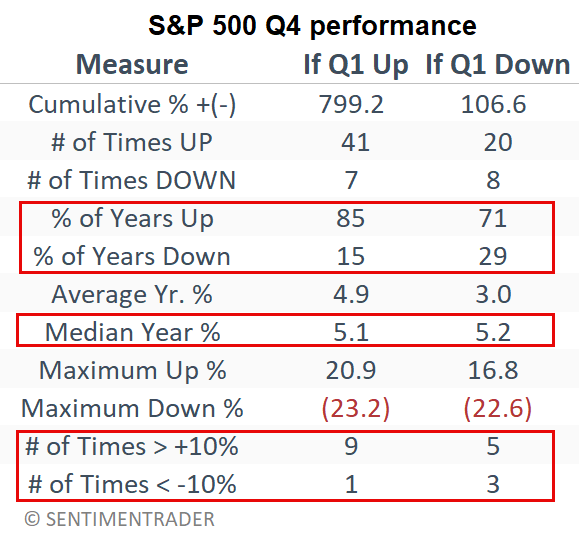
The median quarterly return is roughly equal regardless of Q1 performance. Still, the Win Rate is higher (85% to 71%) following a positive Q1, and the 10%+ gains and losses skew more favorably following a positive Q1 (9 to 1 following positive Q1s versus 5 to 3 following negative Q1s.
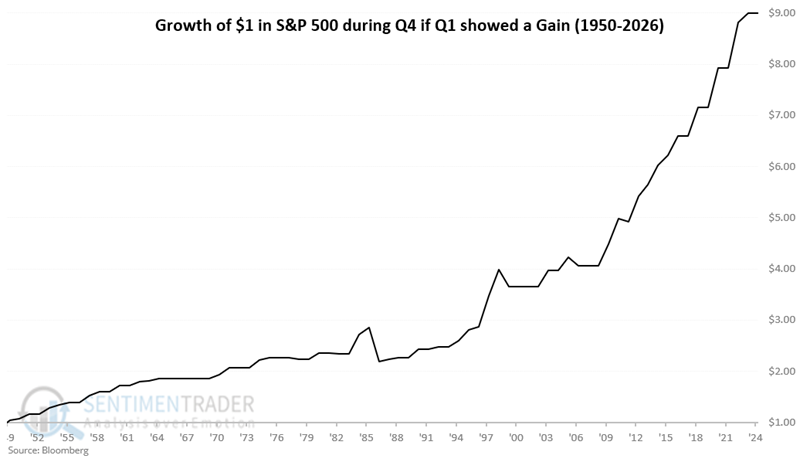
The chart below shows the hypothetical growth of $1 in the S&P 500 during Q4 only during years when Q1 showed a gain. $1 grew to $8.99.
The chart below shows the hypothetical growth of $1 in the S&P 500 during Q4 only during years when Q1 showed a loss. $1 grew to $2.07.
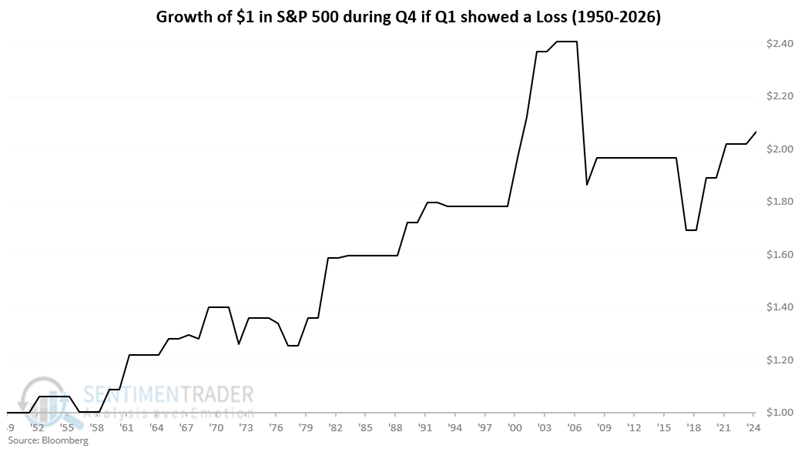
Positive Q1s appear to give rise to stronger Q4s than negative Q1s.
Combining Q2, Q3 and Q4
The table below summarizes S&P 500 performance from April 1st through December 31st, depending on whether the index gained or lost in the first quarter.
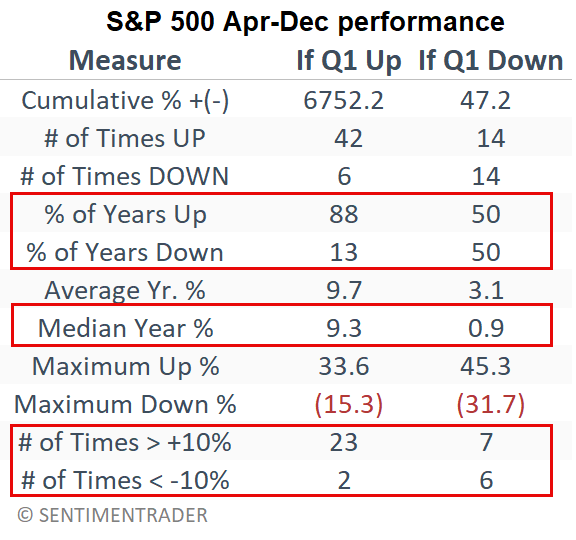
The results drive home why one would prefer to see a positive first quarter for the S&P 500.
- A Win Rate of 88% versus 50%
- A Median return of +9.3% versus +0.9%
- A 10%+/10%- ratio of 23 to 2 versus 7 to 6
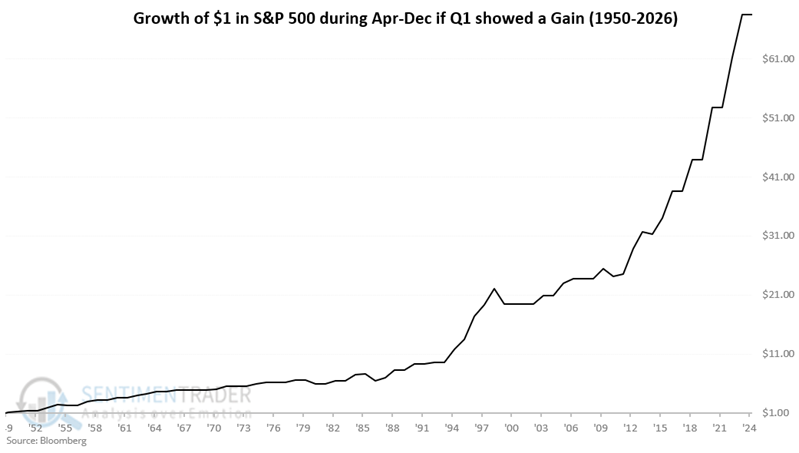
The chart below shows the hypothetical growth of $1 in the S&P 500 from April through December, only in years when Q1 showed a gain. $1 grew to $68.52.
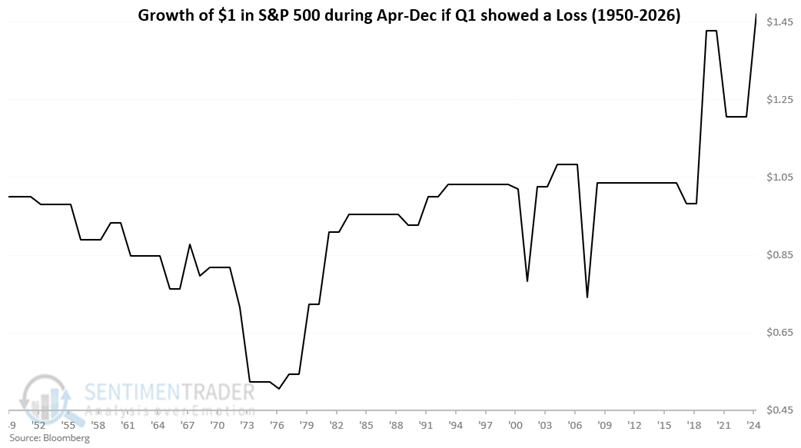
The chart below shows the hypothetical growth of $1 in the S&P 500 from April through December, only in years when Q1 showed a loss. $1 grew to $1.47.
What the research tells us…
Investing is often a game of odds. The results show a clear tendency for the stock market to perform better in the remainder of the year if the S&P 500 registers a gain in the first quarter. That said, results can vary greatly from year to year. In addition, an up Q1 does not guarantee a gain for the rest of the year, just as a down Q1 does not guarantee a down Q2 and Q3, or the remainder of the year. Still, the S&P 500's Q1 2026 loss shifts the historical odds from an 88% tendency for a gain the rest of the year to a mere 50/50 shot. Investors should pay close attention to price trends for the rest of the year. If price action is favorable, a bullish position may be warranted. But as long as the majority of major stock market indexes remain below their respective 200-day moving averages, investors might do well to adjust their expectations and adopt a more defensive stance.