
What pullbacks in an uptrend mean for the market

Key points
- Our Panic/Euphoria Model detected a recent wave of pessimism as the market declined from August through October
- The ROBO Put/Call Ratio detected a wave of put option buying by small traders
- These occurrences have historically shown a strong tendency to highlight buying opportunities
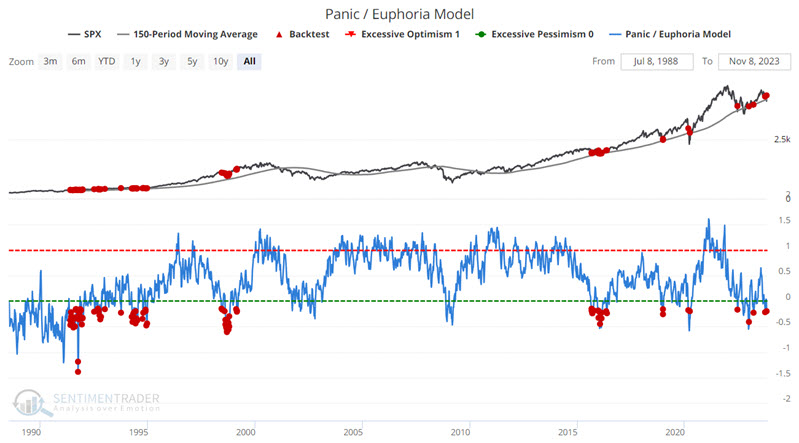
The Panic/Euphoria Model reverses off of a low reading
As the name implies, our Panic/Euphoria Model is designed to highlight extremes in investors' sentiment. Our model is based on the Citi Panic / Euphoria model published in Barron's magazine. It does not reflect those published values; instead, it is our interpretation of the model inputs and construction and differs modestly from the published figures. The inputs are the same. However, its performance as a contrary indicator is improved over the published values. It is composed of the following primary inputs: NYSE short interest, margin debt, Nasdaq vs NYSE volume, Investor's Intelligence survey, AAII survey, retail money market funds, put/call ratios, commodities prices, and retail gasoline prices. The higher the model, the more investors are in a euphoric mood, with lower expected stock returns going forward. Low values, particularly below zero, suggest investors have panicked, and higher forward returns are expected.
The chart below highlights all dates when the Panic/Euphoria Model was below -0.15 while the S&P 500 Index was above its 150-day moving average. Essentially, this configuration purports to highlight pullbacks in an uptrend - which can often offer useful buying opportunities. The most recent signal occurred on 2023-11-03.
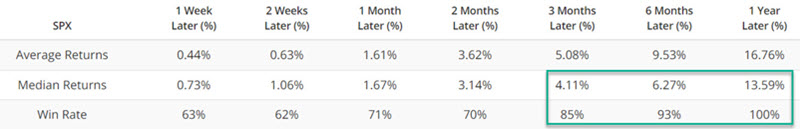
The table below summarizes subsequent S&P 500 performance. The critical thing to note is this: Since 1988, there have been 92 trading days on which the indicator was below -0.15, and the S&P 500 was above its 150-day moving average (including overlapping signals). All 92 occurrences were followed by a gain for the S&P 500 Index twelve months later. That does not mean that the market is "guaranteed" to be higher a year from now, but it is a signal that falls on the favorable side of the ledger.
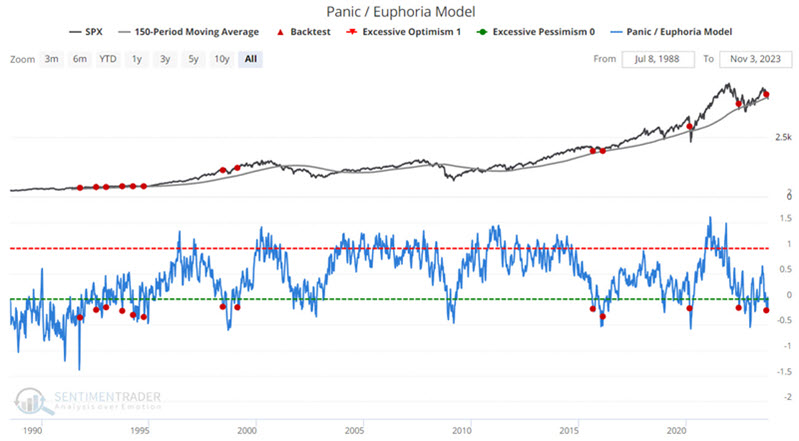
To eliminate some of the duplicate signals, the test below highlights only those signals that occurred six months apart. With this limitation in place, the most recent signal occurred on 2023-10-06.
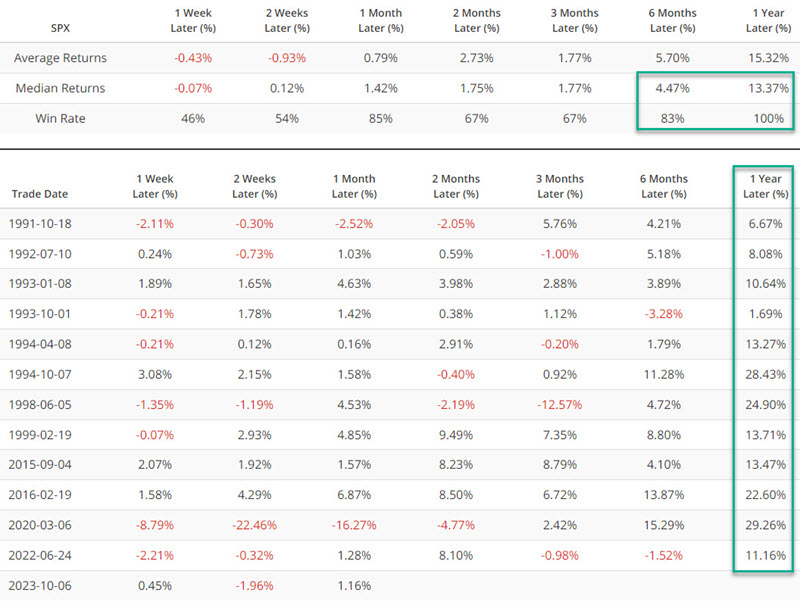
There are never any guarantees regarding any signal from a marker indicator. That said, a signal that has previously shown no twelve-month declines in 32 years would seem to fall on the favorable side of the ledger.
Retail option traders recently piled into put options
ROBO is an acronym we coined for Retail-Only, Buy-to-Open.
This ratio focuses on small traders to better understand what they're trying to do. When looking at put/call information, it is most helpful to see if the volume is going into opening transactions or closing transactions, as it will tell us how aggressive the traders are in betting on a market move. Also, especially for very small traders, buying options to open is more telling than selling options to open.
A small trader buys a call option to open a position because he thinks his stock is going higher. He buys a put option to open because he thinks his stock is going down. You may argue that he's trying to hedge some underlying stock position, but it doesn't matter. If he thinks his stock is going up, he won't buy a put just for the thrill of it.
Suppose we isolate the trades to just those of 10 contracts or less and further restrict them to buys and opening transactions only. In that case, we can get an accurate picture of what retail traders (i.e. small brokerage firm customers) are doing.
This ratio looks at transactions that are buy-to-open only and only for those trades that are under ten contracts. Therefore, it is an excellent read on the emotions of the smallest of traders and should be interpreted in a contrary manner.
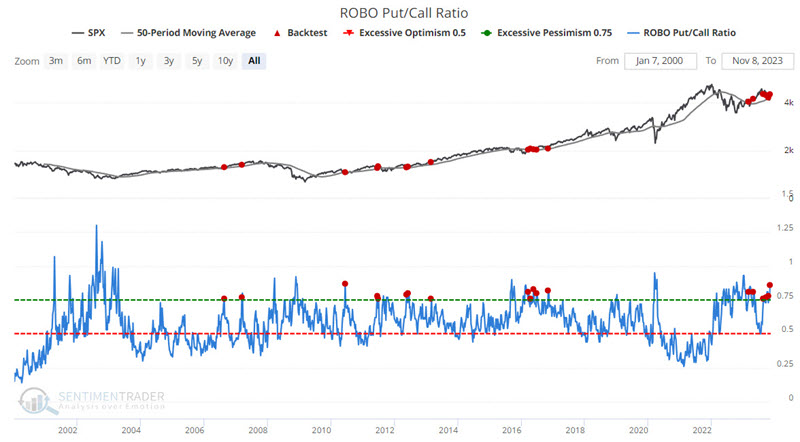
When the ROBO put/call ratio is high, that means small traders are buying many puts in relation to calls, which suggests that they believe their stocks will decline. This is bullish for the market once it reaches an extreme. On the other hand, when these traders are so confident of their stocks rising that the ROBO ratio drops to a low level, then we need to be aware that sentiment is becoming too frothy, and a market decline may soon be at hand.
The chart below highlights those dates when the ROBO Put/Call Ratio rose above 0.75 while the S&P 500 Index was above its 50-day moving average. The most recent signal occurred on 2023-11-03.
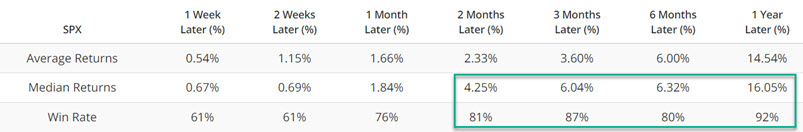
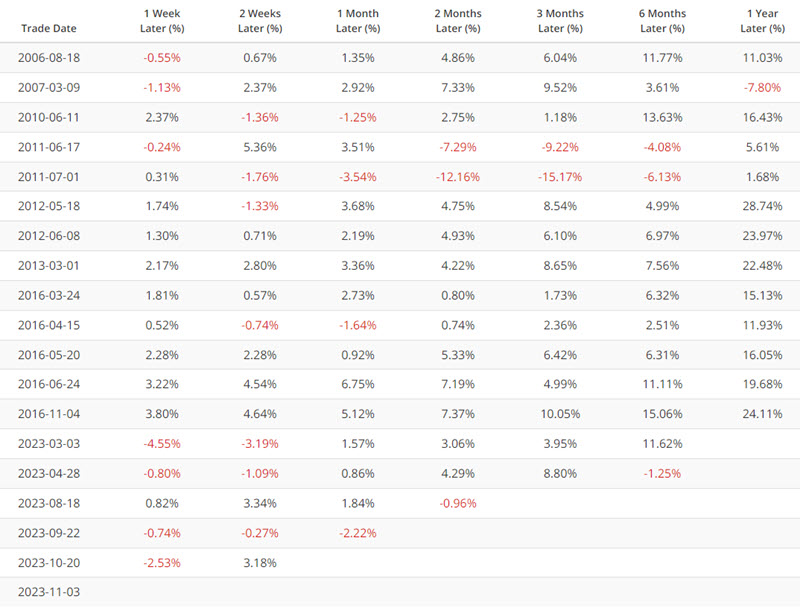
The table below summarizes subsequent S&P 500 performance.
What the research tells us…
When the market pulls back within the context of an established uptrend, the big question is always: Is this a normal pullback - and thus a buying opportunity? Or is it the start of something worse? As always, past performance is no guarantee of future results. That said, the signals highlighted above fit the pattern of previous buying opportunities and suggest continuing to give the bullish case the benefit of the doubt.