
What January Performance Suggests for the Rest of 2026

Key Points:
- The original January Barometer was developed by Yale Hirsch back in the early 1970s
- Our own tweaked version - called the January Model - hit its most favorable possible reading at the close on January this year
- Overall, the action in January 2026 was favorable for stocks
The Venerable January Barometer
The "January Barometer" was first introduced by the legendary Yale Hirsch, founder of the Stock Trader's Almanac. Per the Almanac, the theory is that "as January goes, so goes the year." In other words, a favorable January should be followed by higher stock prices from the end of January through the end of December. The historical track record is compelling. Hirsch and STA also introduced the "First Five Days" indicator, which suggests that the first five trading days of the year offer clues about the rest of the year.
We tweaked the original version and came up with the January Model (which can be defined as "Favorable" or "Unfavorable" on any given day) and the January Model Signal (which will be rated as +1 or 0 depending on whether the January Model is favorable or unfavorable).
The January Model and January Model Signal
If the S&P 500:
- closes the month of January with a gain for the month, then A = +4 else A = 0 UNTIL the end of January the following year
- closes the first five trading days of January with a net gain, then B = +2 else B = 0 UNTIL the close of the fifth trading day of the following year
- closes the last five trading days of January with a net gain, then C = +1 else C = 0 UNTIL the end of January the following year
Variable D = A + B + C
Variable D can equal 0, +1, +2, +3, +4, +5, +6, or +7
The January Model = Variable D
The January Model is considered to be:
- "Unfavorable" if D = 0, 1, or 3. Hold cash if D = 0, 1, or 3
- "On a Buy Signal" If D = 2, 4, 5, 6, or 7. Hold stocks if D = 2, 4, 5, 6, or 7
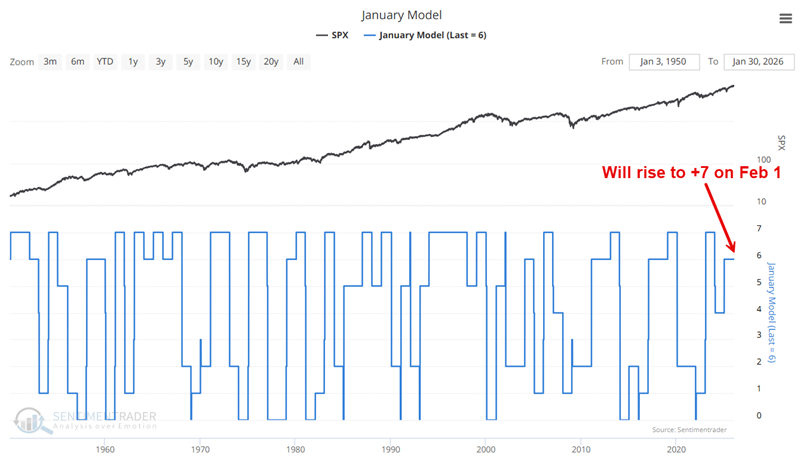
The chart below displays historical readings for our January Model. Note that because the first five days, the last five days, and the month of January 2026 all showed a gain, the January Model now reads +7.
The January Model Signal:
- Will read +1 if the January Model is "Favorable"
- Will read zero if the January Model is "Unfavorable"
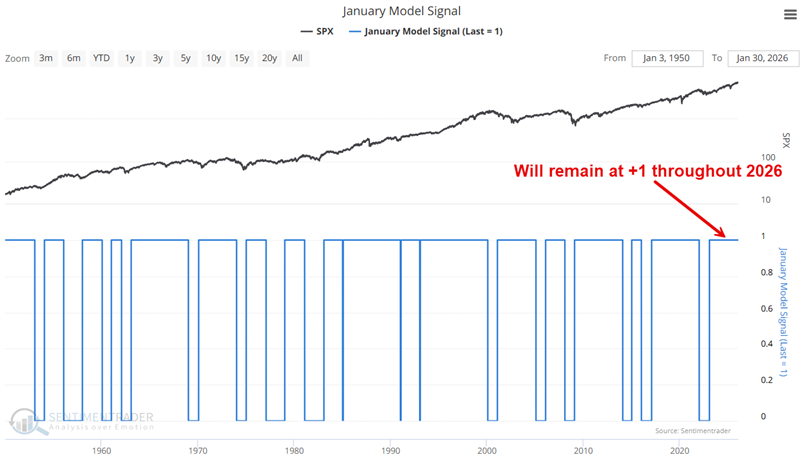
The chart below displays historical readings for our January Model Signal.
Now that we know how the January Model is constructed and how the January Model Signal is generated, let's look at its current status.
The January Model after January 2026
The relevant results for January 2026 are as follows:
- During the first five trading days of January 2026, the S&P 500 gained +1.11%
- During the last five trading days of January 2026, the S&P 500 gained +0.34%
- During the entire month of January 2026, the S&P 500 gained +1.37%
As a result, the January Model now stands at its highest possible reading of +7 and will remain there through at least the first five trading days of 2027. Does this "guarantee" higher stock prices over the next 11 months? Not at all. However, the historical results are compelling and suggest that's the way to bet.
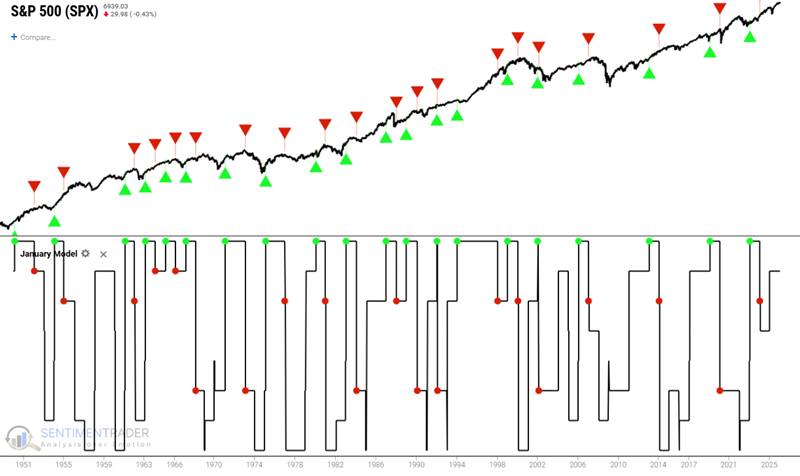
Historical performance during periods of January Model = 7
The chart below shows the previous periods when the January Model was equal to +7 (note that the newest signal will appear after January 30th as an up green arrow).
The table below summarizes S&P 500 performance during the previous +7 periods.
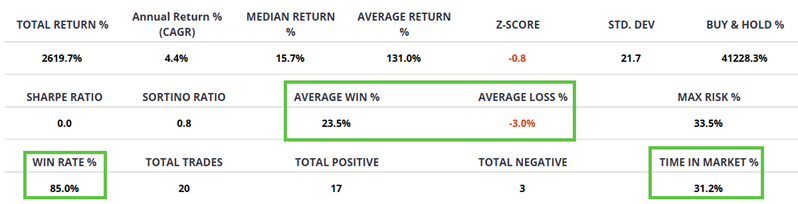
The key things to note are:
The model has only read +7 31% of the time since 1970
- The Win Rate is a solid 85%
- The Average Win to Average Loss ratio stands at a robust 7.83-to-1 (23.5% to -3.0%)
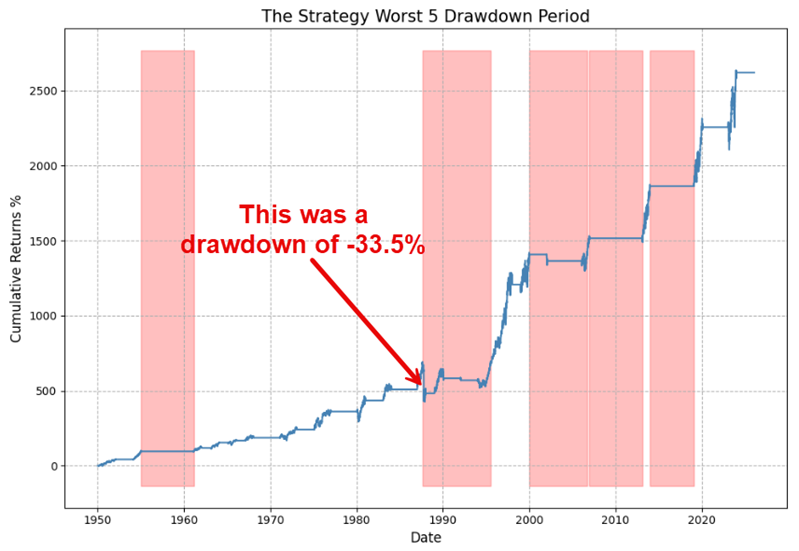
The chart below shows the hypothetical cumulative percentage gain from holding the S&P 500 only when the January Model = +7.
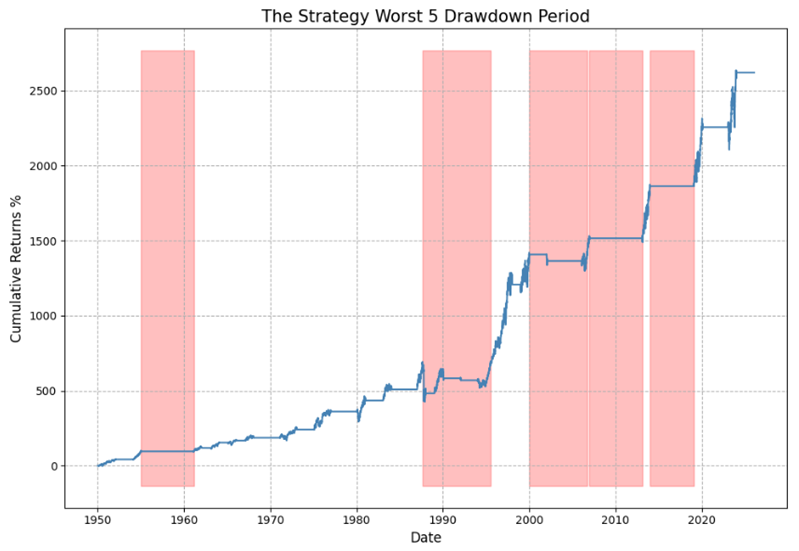
A glance at the chart above reveals a clear "Lower Left to Upper Right" trajectory. And, in fact, most intra-position drawdowns held to a very manageable level. That said, the reality of real-world trading compels me to point out that this model signal was long stocks throughout 1987 and thus rode the "Crash" of October 1987 all the way down, or -33.5% from peak to valley. So, no one should believe that stocks are a lock to trend ever higher over the next 11 months (Sorry, I don't make the rules).
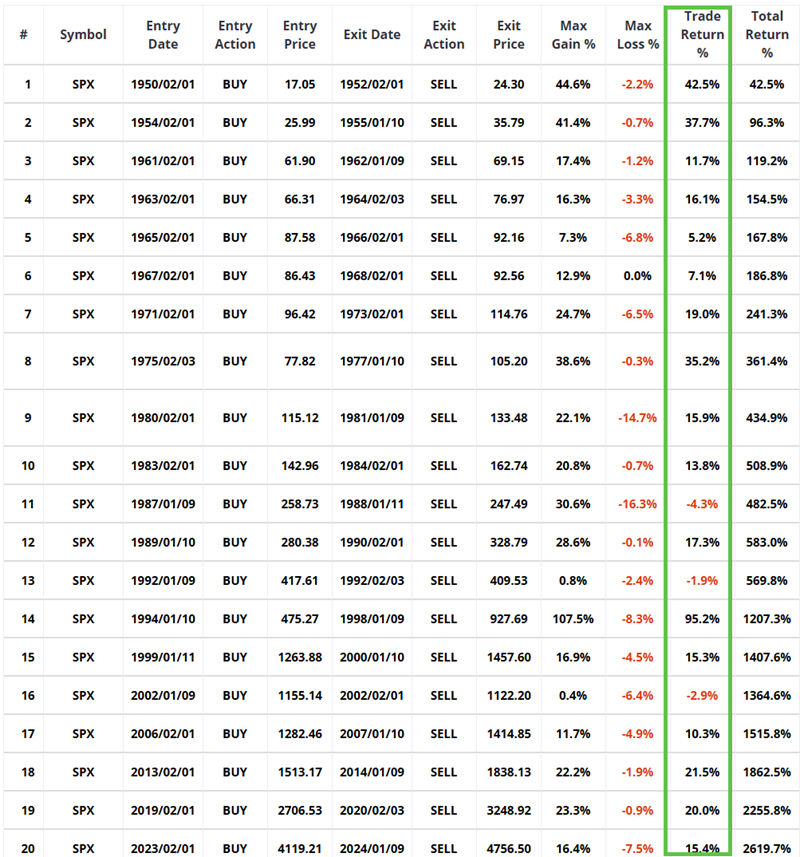
The table below shows trade-by-trade results for previous +7 periods.
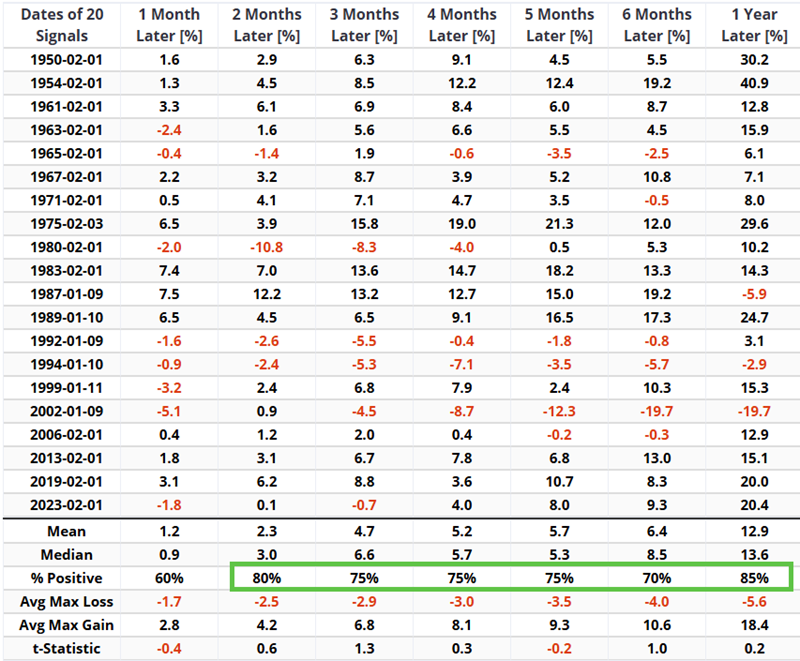
The following table shows trade-by-trade results over different time frames after a new signal.
Once again, under the "real-world trading" category, the table below allows us to assess the actual risks of following the signals presented.
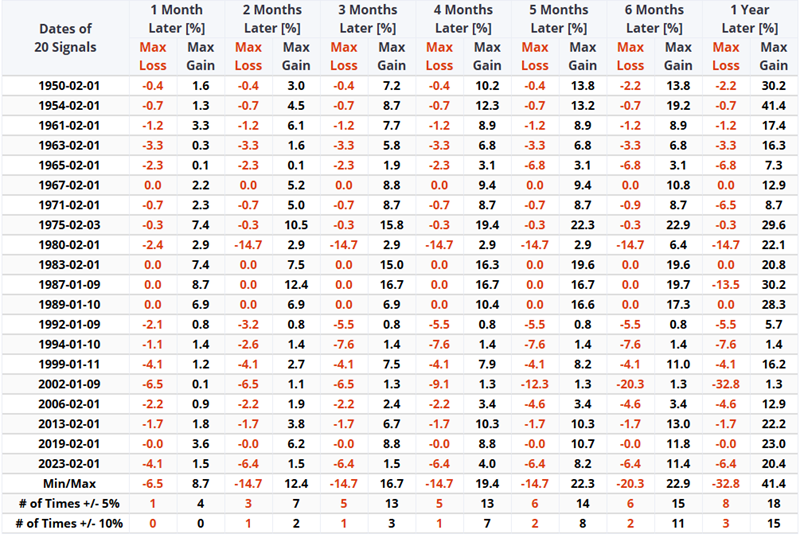
Note that:
- The 1980 signal experienced a maximum open loss of -14.7% (but ultimately ended with a gain of +15.9%)
- The 1987 signal experienced a maximum open loss of -13.5% (but ultimately ended with a loss of just -4.3%)
- The 2002 signal experienced a maximum open loss of -32.8% (but ultimately ended with a loss of just -2.9%)
Finally, the table below displays performance data for the S&P 500 sectors during January Model = +7 periods.
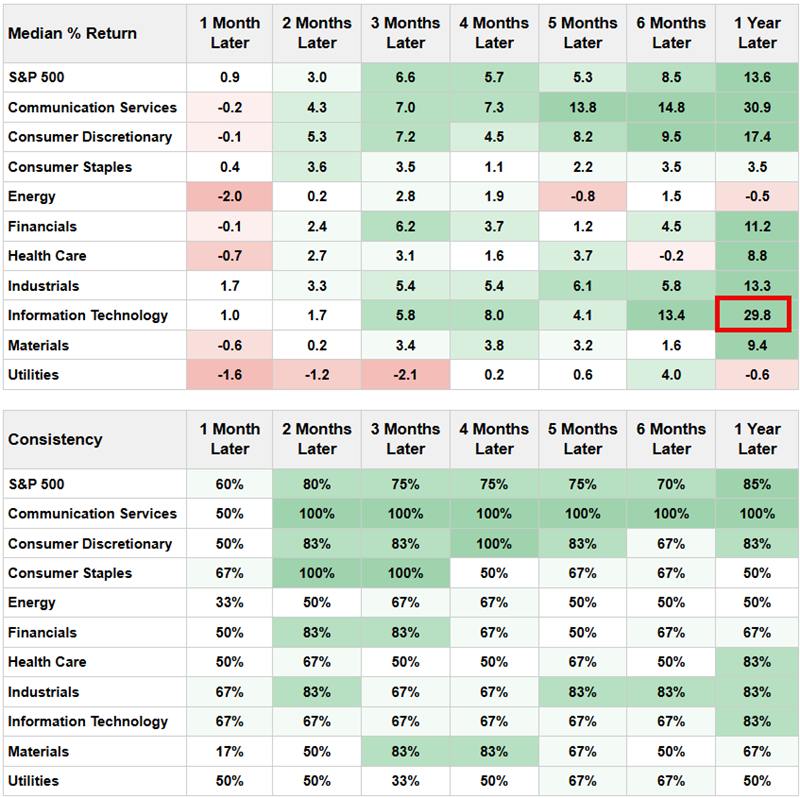
At the moment, there is a lot of talk about how the Technology sector got "overbought" in recent years and is "presently lagging" the overall market. That said, aggressive investors might still take note of the outsized historical 1-year Median return of 29.8% for the S&P 500 Technology sector during the previous January Model = +7 periods.
What the research tells us...
The January Model is on a Buy Signal through at least the end of January 2026. Likewise, the model will be at a reading of +7 through at least the first five trading days of 2027. Higher stock prices in the year ahead have typically followed +7 readings from the model. However, as with any indicator or model, there are no guarantees, and the current favorable reading should be viewed as "weight of the evidence" rather than a standalone trading model or a signal of "smooth sailing" ahead.