
What is the Recent Market Sentiment?

Key Points:
- Recently, the sentiment of small speculators has shifted
- The Economic Surprise Index and consumer confidence indicators show a divergence
- All market sentiment indicators are at elevated levels
Small Spec Index Position Data Continues to Rise
First, it is worth noting the Small Spec Index Position, an indicator that typically reflects the sentiment of retail investors or non-commercial hedge traders. We have observed that this indicator has been on a steady rise since April 2025.
This growing sentiment is understandable given the recent record highs in the market. To assess the impact of this sentiment growth, we conducted backtests on historical scenarios with similar "new high" conditions.Related Backtest Click Here.
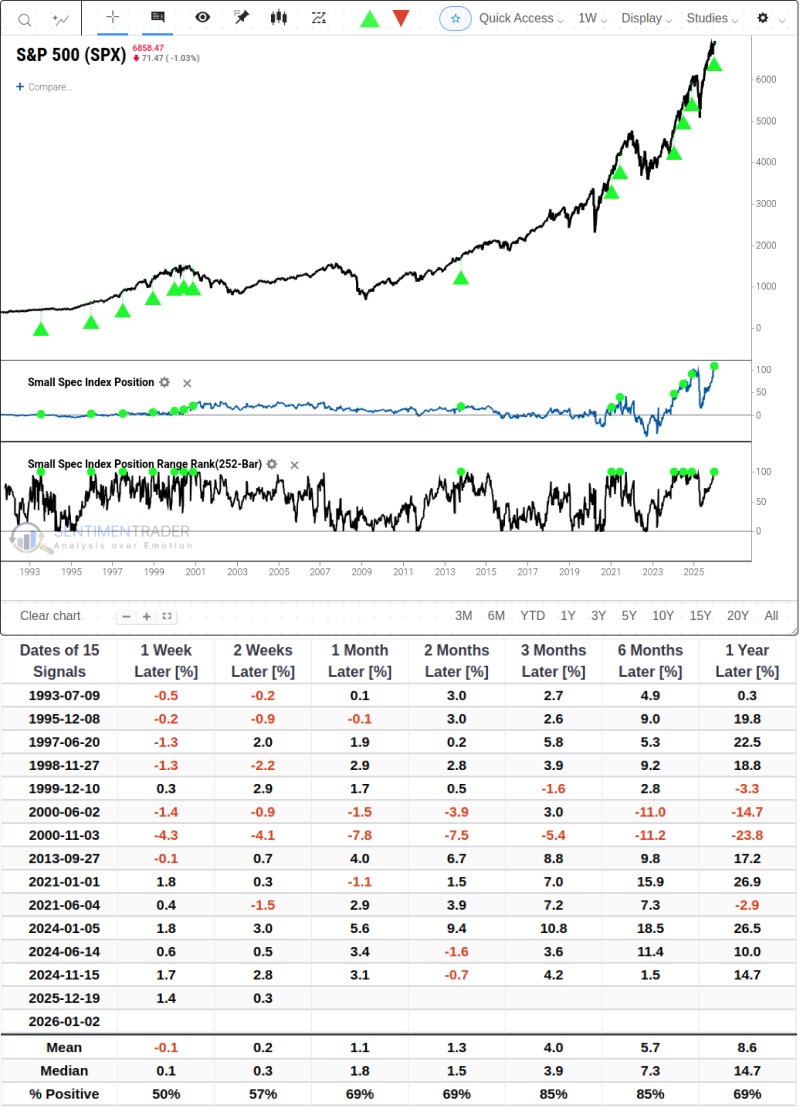
Historical statistics show that the market tends to perform best in the 3 months following the signal trigger, with an 85% win rate and an average return of 4.0%. This indicates that in the medium term, despite overheated sentiment, the inertial momentum of sentiment may still be sufficient to support the market.
Soft Vs Hard Economic Surprises Remain at Low Levels
The Soft Vs Hard Economic Surprises index is currently at a relatively low level, with a slight rebound after hitting a one-year low. This indicator measures the gap between economic reality (hard data) and market expectations or survey data (soft data).
We note that this indicator has been hovering at a low level recently, with the latest upward break above -1.7.Related Backtest Click Here.
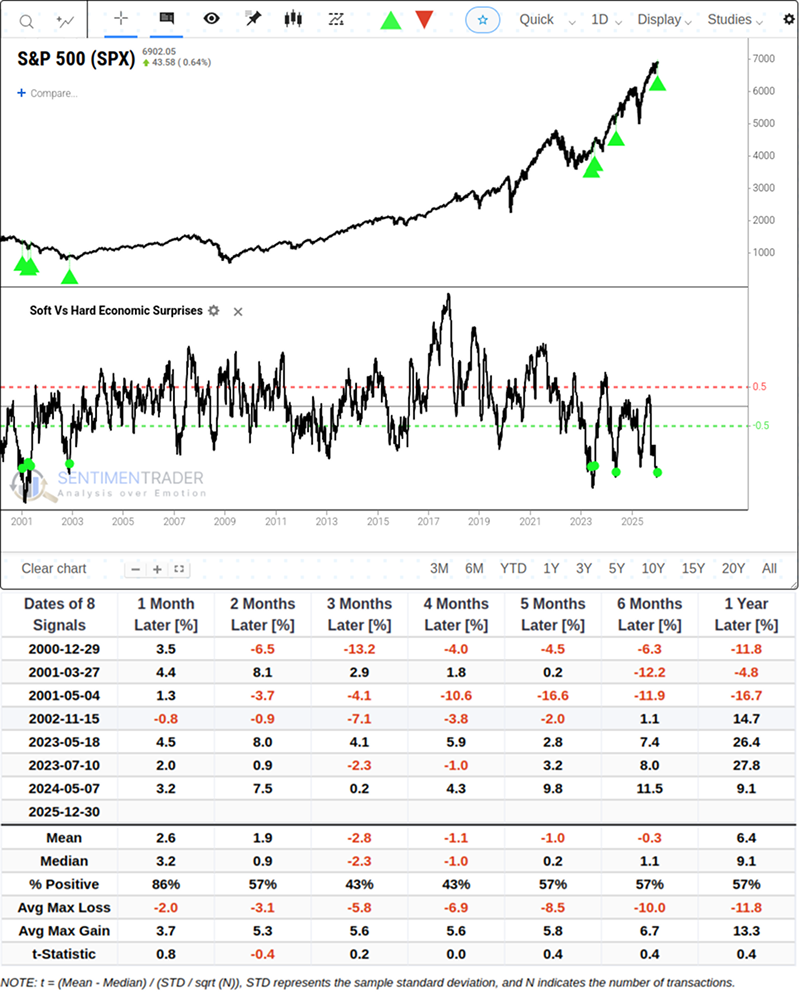
The market has a relatively high win rate (86%) and decent performance within one month after the signal trigger. However, if we extend the time horizon, the indicator's performance in subsequent months is relatively mediocre.It is important to note that persistently weak soft data suggests current market pricing may be overly optimistic, indicating a state of "perfect pricing." Should future hard data-such as nonfarm payroll figures or GDP-fall short of expectations, the market will face significant downward pressure.
Conference Board Consumer Confidence - Stocks Subindex Continues to Grow
The Conference Board - Stocks indicator is currently at a high level. This monthly updated indicator reflects consumers' confidence in the stock market.
We backtested the golden cross of 25 for this indicator at its current high level. While the results show a good win rate in the months following the signal trigger, we must be alert to the risk component involved.Related Backtest Click Here.
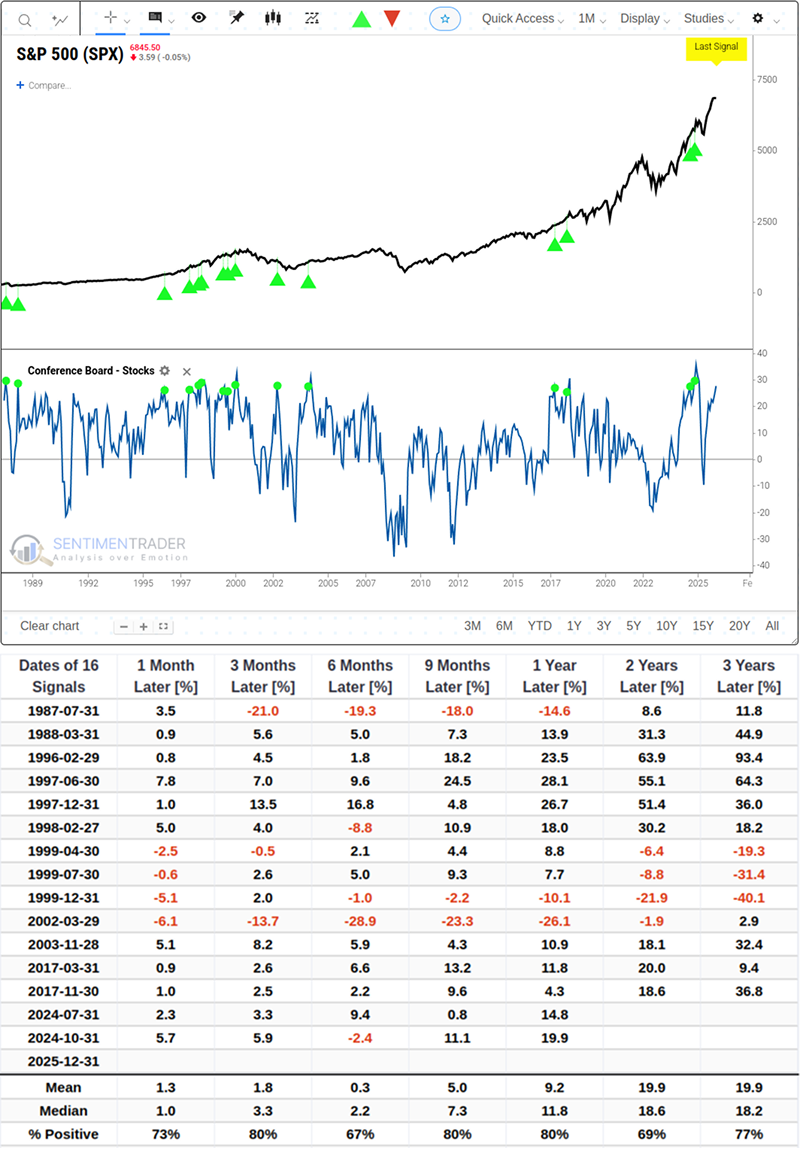
Historical data shows that during similar periods of high confidence, there have been multiple double-digit market pullbacks in previous years (e.g., 1987, 2002, etc.). In other words, when public confidence in the stock market is extremely high, it is often accompanied by potential volatility risks, and investors should not ignore this asymmetric risk-reward ratio.
Sentiment and Insider Trading Point to Excessive Optimism
Finally, we need to examine a set of indicators that reflect extreme market psychology.
First, the % Showing Excess Optimism-Pessimism Spread is at a high level. When we apply a 5-day moving average to this indicator (to eliminate overly short-term fluctuations) and set a threshold (0.4), there have been 47 similar occurrences in history.
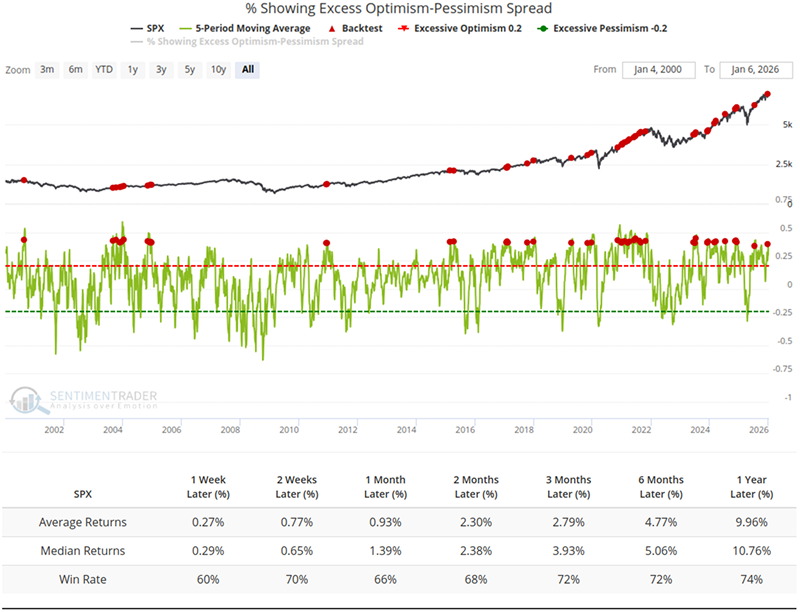
Data shows that the win rate is above 70% three months after the signal trigger.
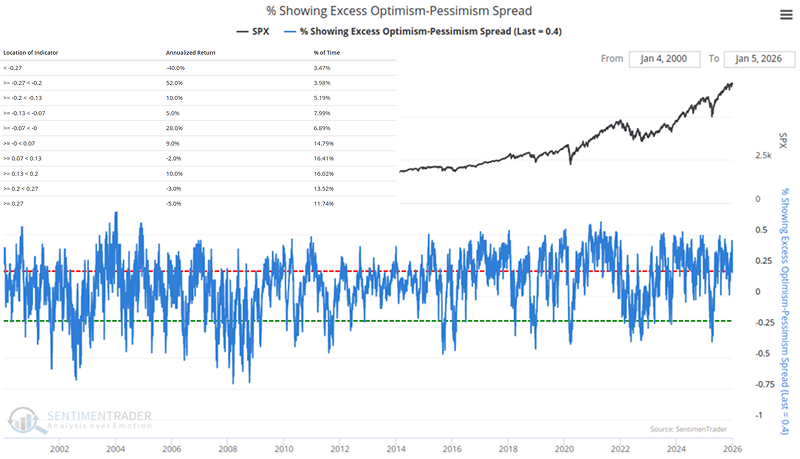
From a threshold perspective, as shown in the figure below, when the indicator is in the extremely high quantile (>= 0.27), the market's historical annualized return tends to be negative (-3.0% to -5.0%). This usually reveals that the market may have priced in too much good news.
Second, the 52-week change rate of the Corporate Insider Buy/Sell Ratio has exceeded 100%.Related Backtest Click Here.
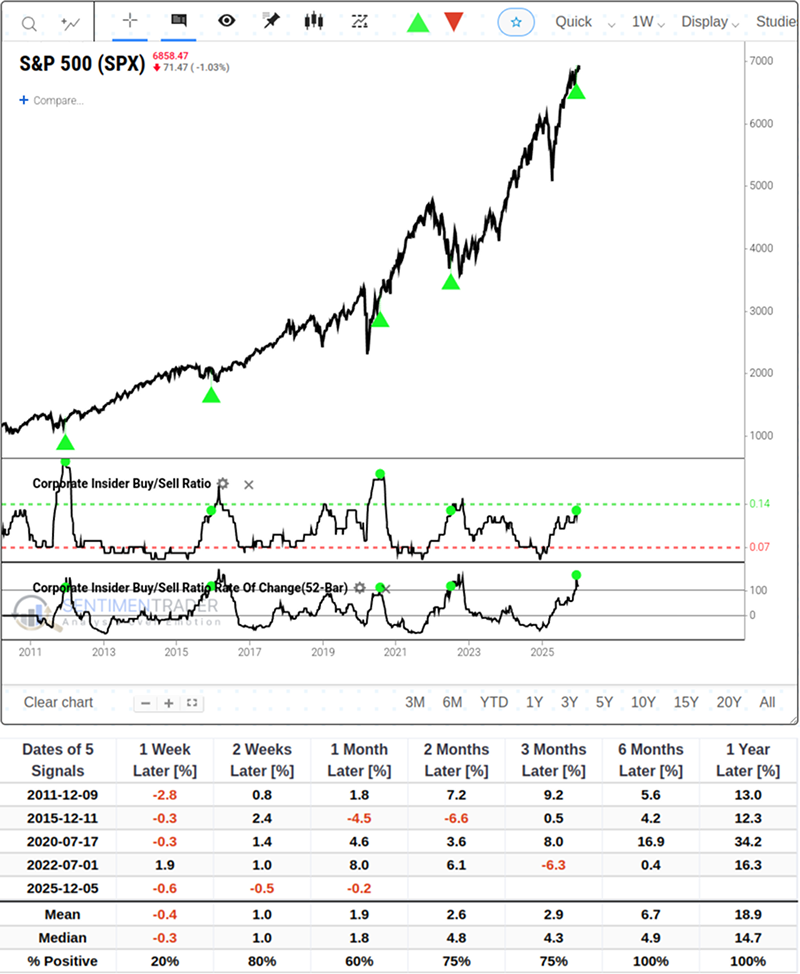
Typically, sharp changes in insider activity precede shifts in market trends. It should be specifically noted that, given the historical sample size of this signal is only 5 instances, its reference value should be treated as "supplementary evidence" rather than a "core predictive basis.". Despite the "perfect" win rate performance observed 6 months to 1 year after signal triggering in this extremely small sample, investors should still exercise caution regarding its statistical validity.
At the same time, the Speculators Combo indicator has remained at the full value of 100 (or near full value) for three consecutive weeks.Related Backtest Click Here.
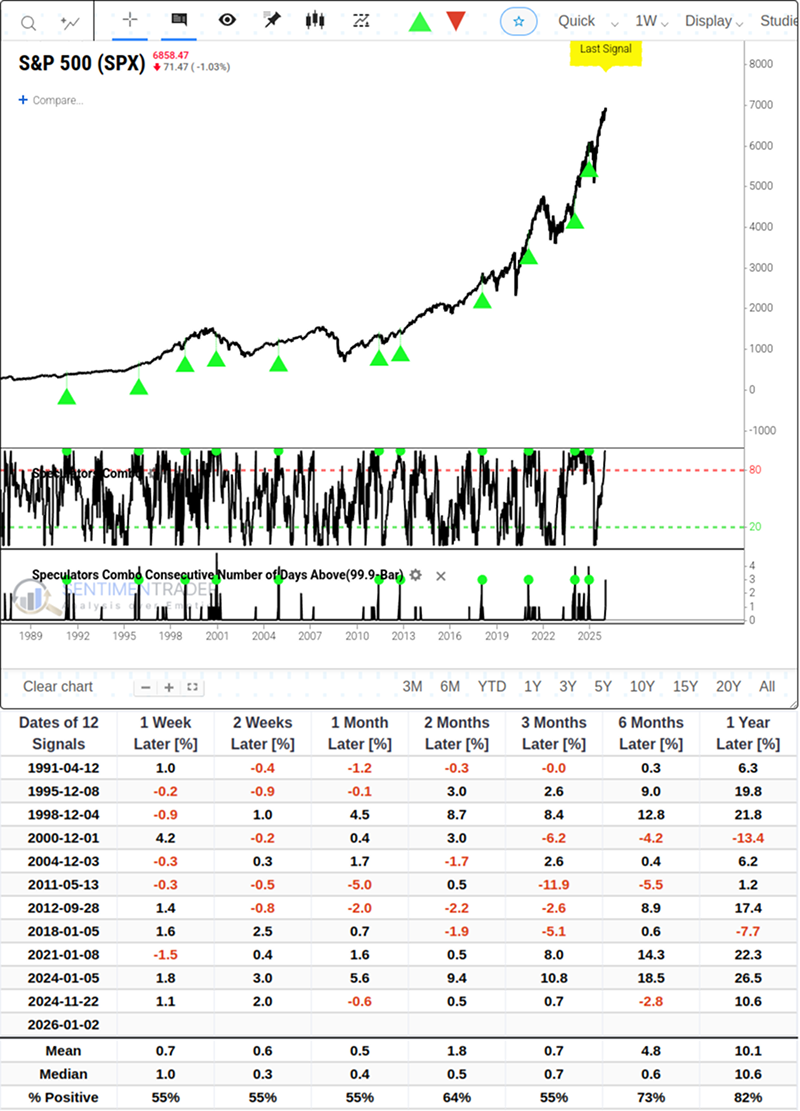
This consistent extreme bullish sentiment, while reflecting strong trend momentum (with an 82% win rate after 1 year), also means that potential buying power in the market may be exhausted, and return volatility may intensify in the short term (1 to 2 months).
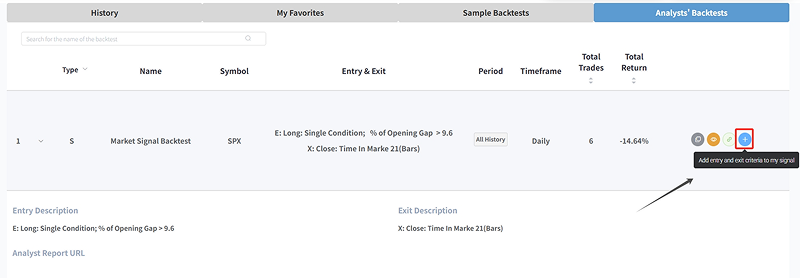
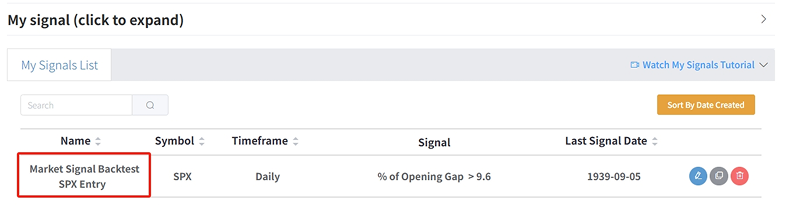
Never miss a crucial signal again. The Analysts' Backtests interface now features a "+ Add to My Signals" button that lets you instantly import entry and exit criteria from any analyst's backtest (e.g., a Trend Tracking Backtest, Market Signal Backtest, or other strategy) into your personal My Signals List.
What the Research Tells Us...
It needs to be reiterated that "indicators" are not equivalent to "trading signals". Trading systems aim to capture specific entry points, while indicators are used to construct a big picture of the market environment.
The signals detailed above present different scenarios. On one hand, the frenzy of small speculators and the full value of the Speculators Combo indicator show strong short-term market momentum, and historical data suggests this momentum may persist for the next 3 months. On the other hand, the long-term weakness of the Economic Surprise Index, historical pullback records behind high consumer confidence, and extreme readings of optimism all remind us that the market may be in a fragile phase of "perfect pricing".
These do mean that while investors can enjoy the current trend, their vigilance against risks should be raised to a higher level than usual. We present the observed indicator conditions in the market to provide you with a perspective on the overall market landscape. These are not holy grails in trading, as various unforeseeable scenarios exist in the actual market, such as sudden geopolitical issues and black swan events.