Products
SentimenTrader Trading Tools
‍
Backtest Engine
My Trading Toolkit
Correlation Analysis
Seasonality
Indicators & Data API
‍
Proprietary Indicators & Charts
Market Data API
Strategies & Scanner
‍
50+ Trading Strategies
Smart Stock Scanner
Research Reports
‍
Research Solutions
Reports Library
Free Resources
Simple Backtest Calculator
Simple Seasonality Calculator
The Kelly Criterion Calculator
Sentiment Geo Map
Public Research Reports
Pricing
Company
About
In the News
Testimonials
Client Success Stories
Contact
Log inLoginSign up
< BACK TO ALL REPORTS

What I'm looking at - volatility, utilities rotation, index put/call, Germany wholesale, SKEW

Troy Bombardia
2019-10-16
null

With stocks near all-time highs, here's what I'm looking at:


Volatility indices

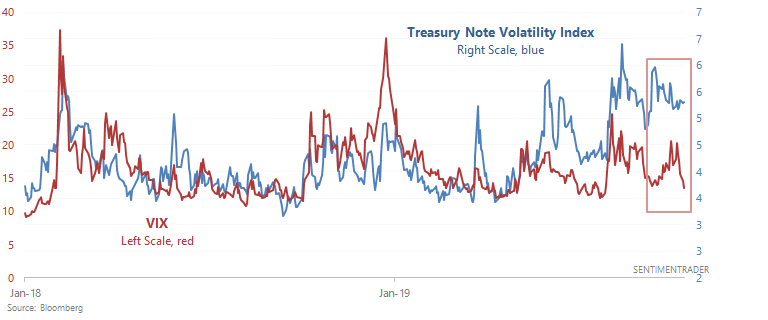
As The Market Ear noted, the stock market's volatility is much lower than the bond market's volatility right now. The Treasury Note Volatility Index remains elevated, while VIX has fallen after a brief spike:

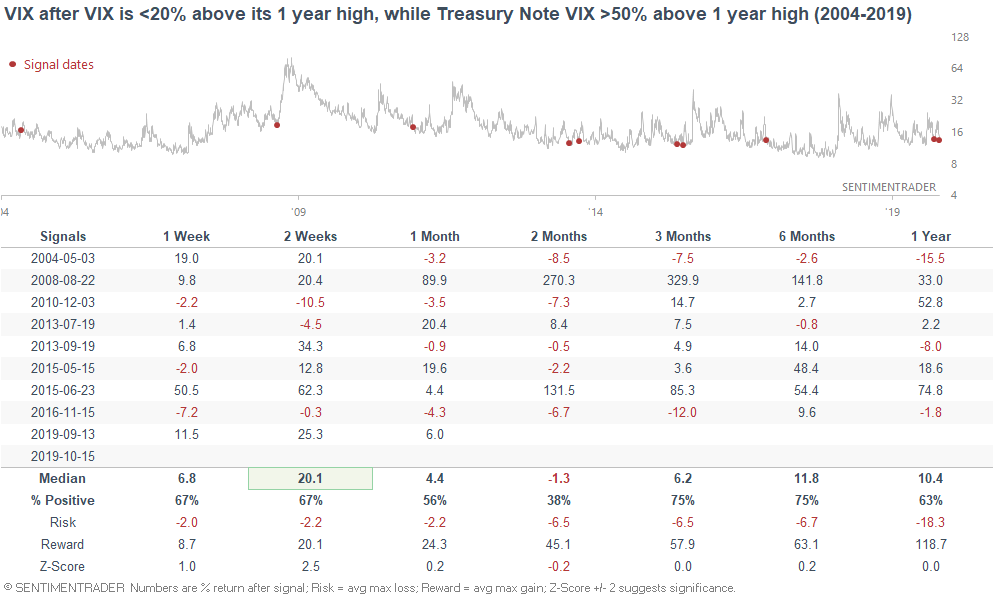
When these 2 volatility indices diverged in the past, VIX had a tendency to jump over the next 2 weeks...

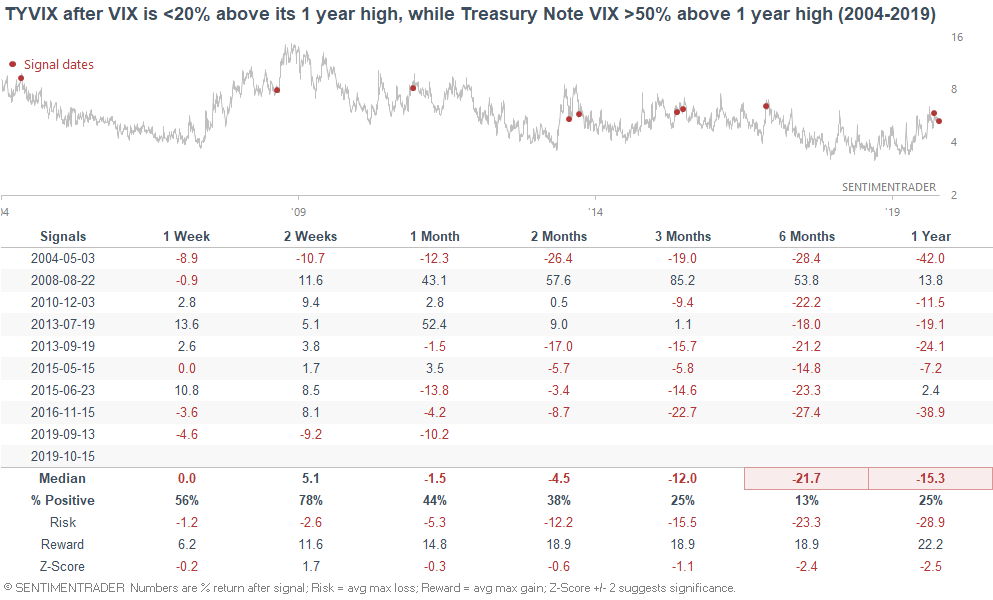
... while Treasury volatility usually fell over the next 6-12 months:


Utilities

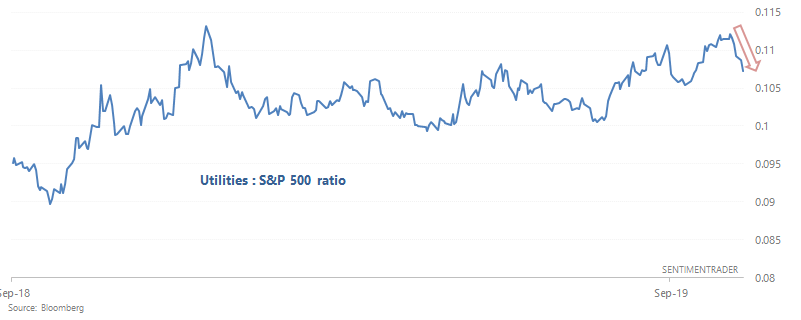
Over the past few weeks we noted the nonstop strength in utilities (defensive sector), while the broader stock market languished. But while stocks rallied over the past few days, utilities fell 4 days in a row.

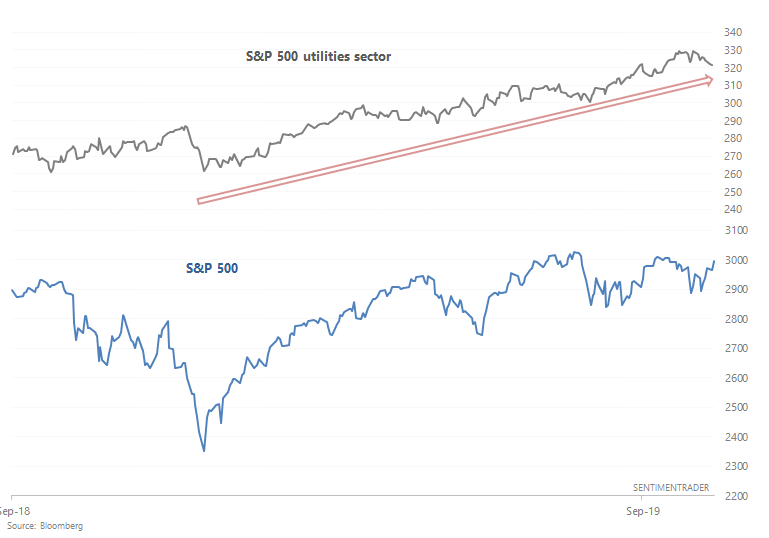
The following chart illustrates the sudden change in relative performance. The S&P 500 utilities sector vs. S&P 500 ratio reached a multi-month peak, and then dropped 5 days in a row:

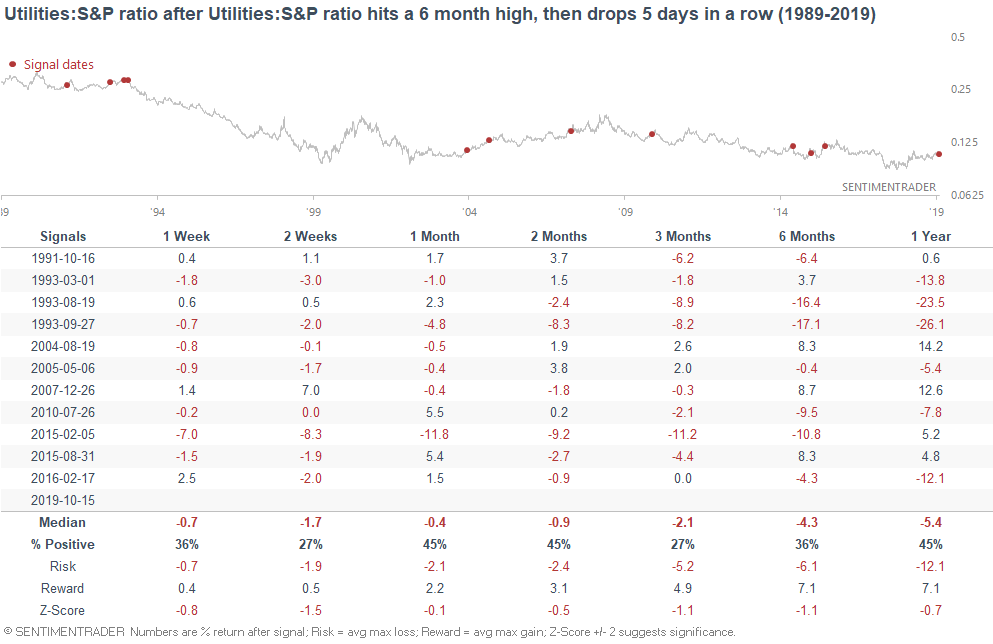
When this happened in the past, utilities usually continued to underperform the broad stock index over the next 3-6 months as investors and traders continued to shift away from defensives:

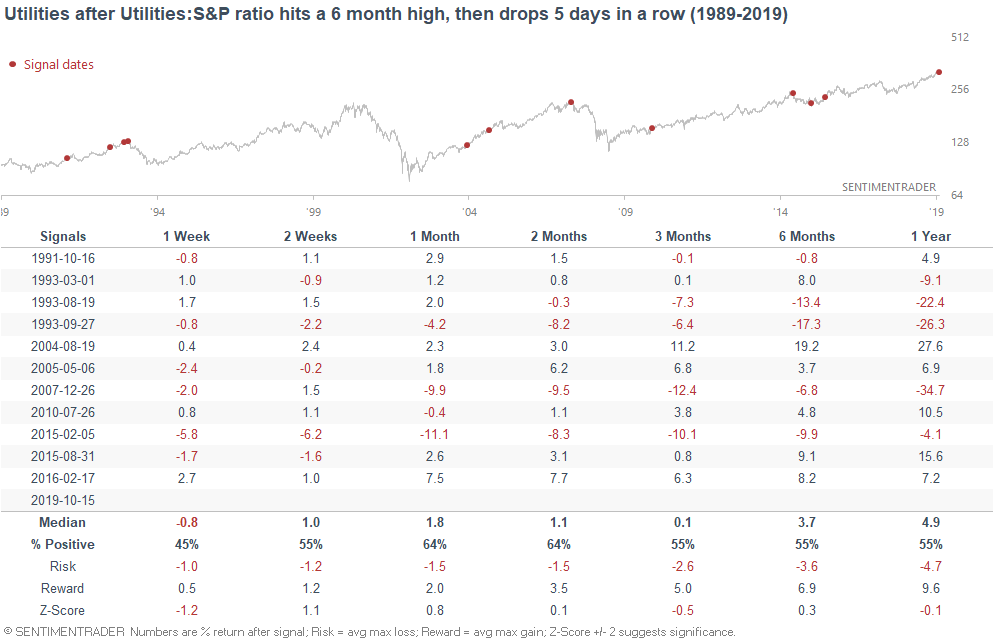
Here's what happened next to the S&P 500 utilities sector:

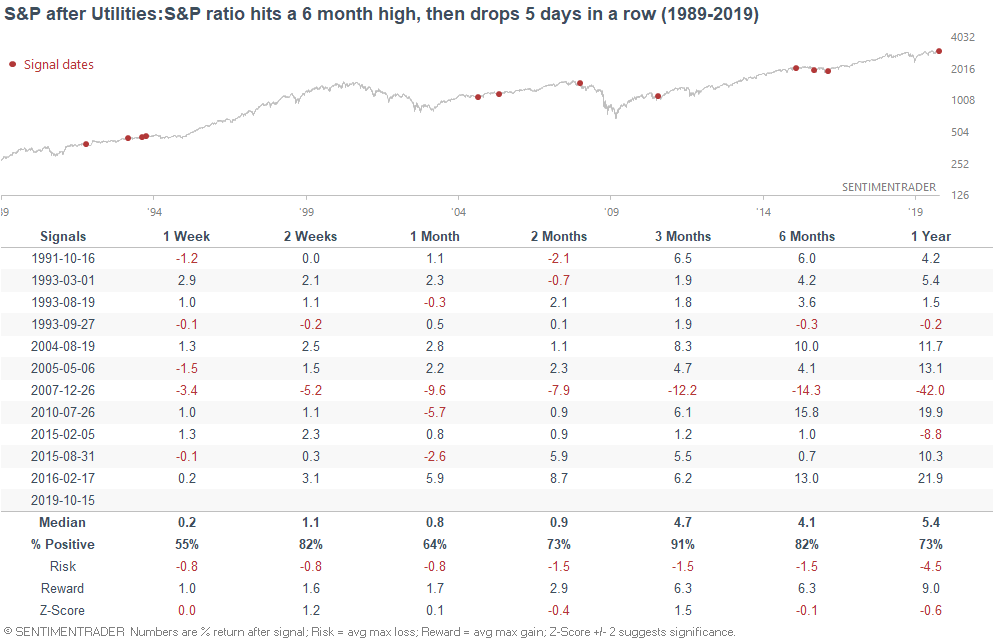
Here's what happened next to the S&P 500:
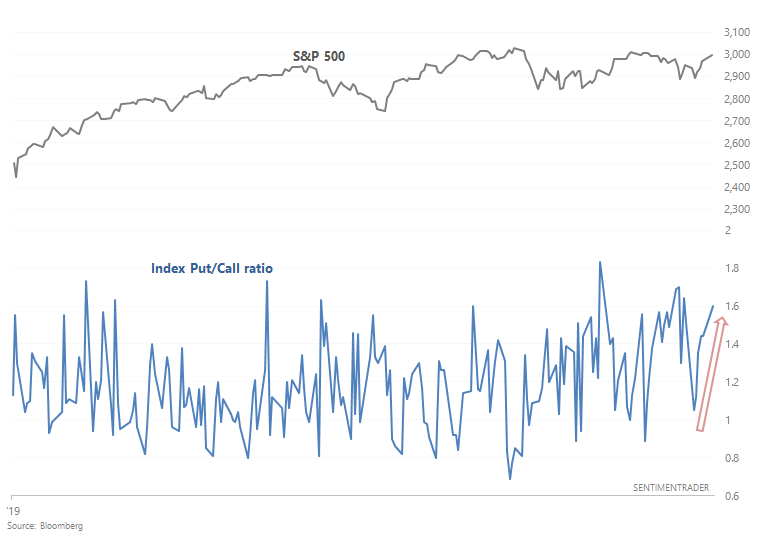

Index Put/Call

Traders continue to be skittish, at least by some measures. While the stock market rallied 4 of the past 5 days, the Index Put/Call ratio also rose 4 of the past 5 days (with the 1 other day being flat). This is highly unusual, because more often than not the Index Put/Call ratio and S&P 500 move in opposite directions:

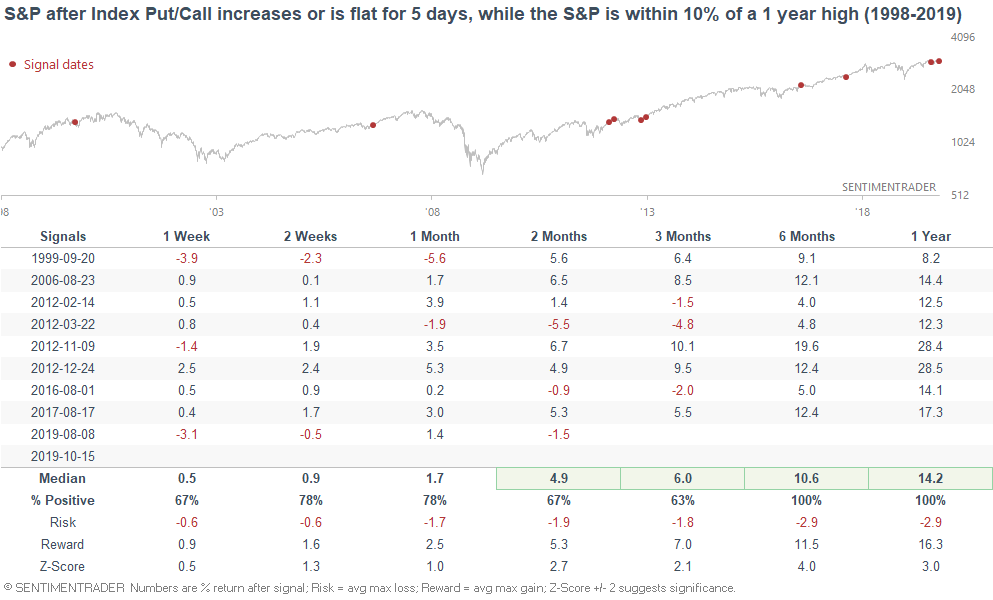
When the Index Put/Call ratio consistently went up over the past 5 days, while the S&P was close to an all-time high, the S&P usually rallied over the next 6-12 months.
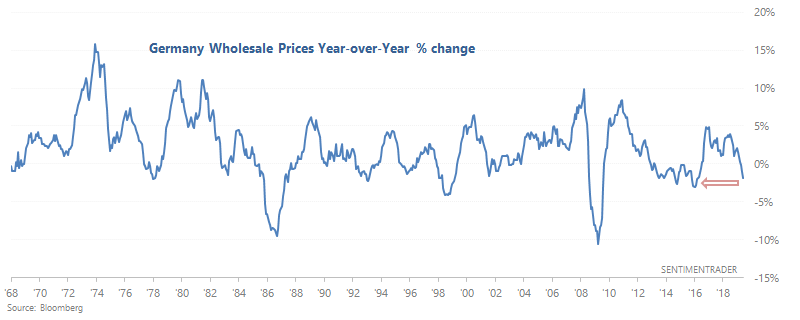

Germany Wholesale

With the German economy on the brink of a recession, German Wholesale Prices have fallen -1.9% over the past year. 

While this may generate scary headlines, it's not clear if this is bearish for German stocks. The following table looks at similar cases and what the DAX did next:

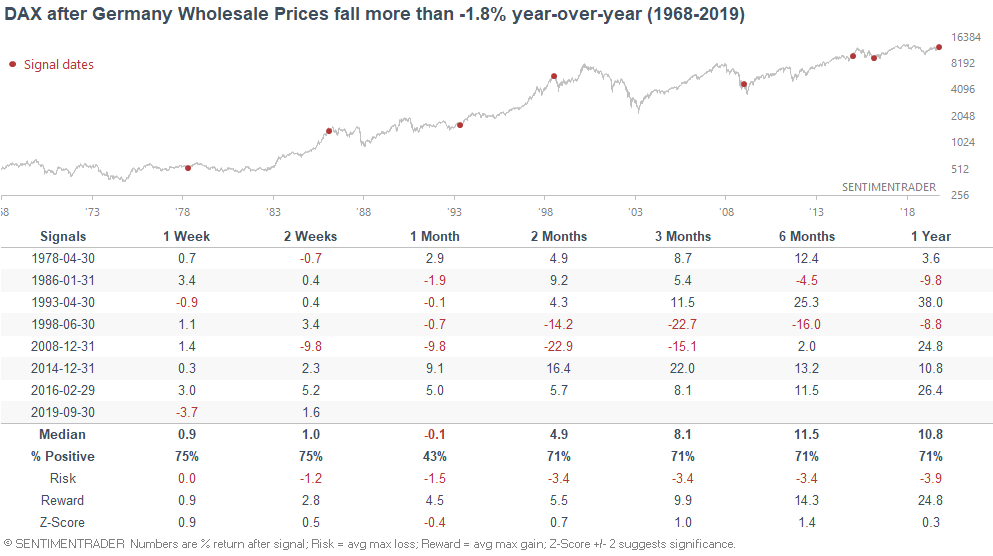
Sure, there were some large stock market crashes over the next 2-3 months (e.g. 1998 and 2008). But there were also plenty of false alarms.

For what it's worth, here's what the S&P did next:

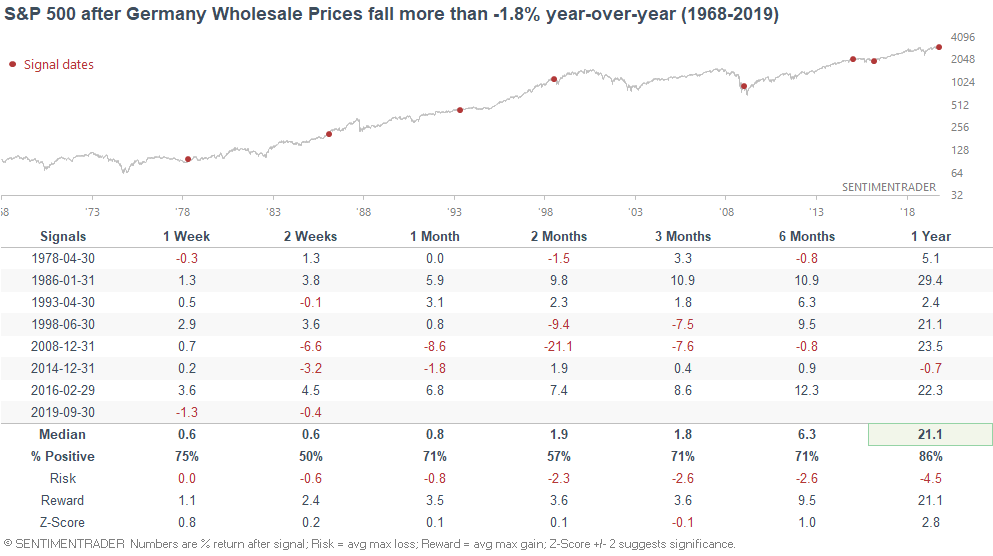
*I wouldn't use German economic data to trade the S&P 500.


SKEW

And lastly, the SKEW Index has jumped to a 6 month high:

*SKEW demonstrates the risk of a black swan event over the next 30 days.

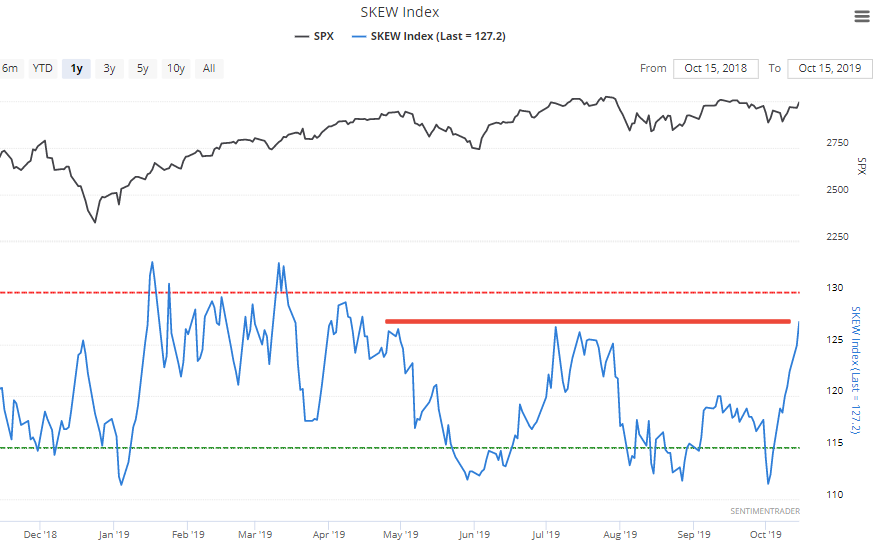
While high SKEW readings aren't usually good for stocks (e.g. SKEW was very high before the Q4 2018 stock market crash), the first decently high reading in a long time isn't bad (like a breakout).

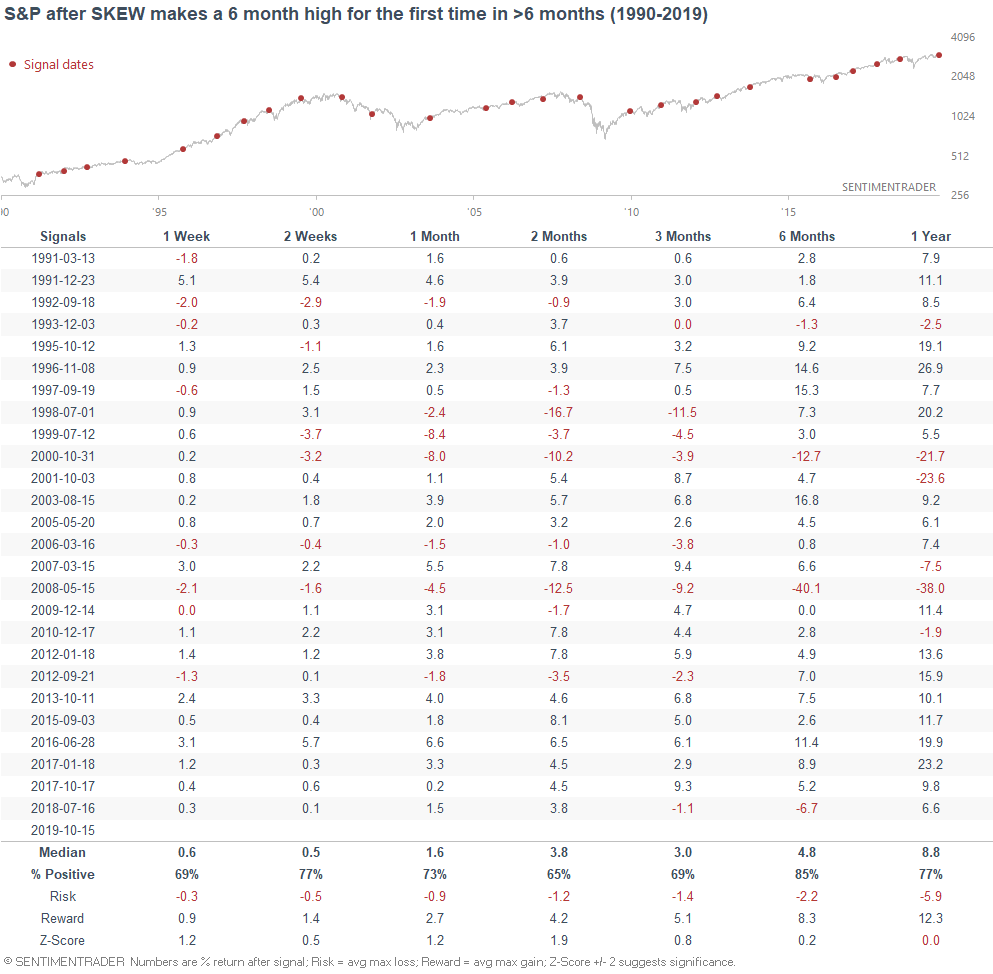
Here's what happened next to the S&P when SKEW made a 6 month high:

And if we isolate for the cases in which the S&P was above its 200 dma...

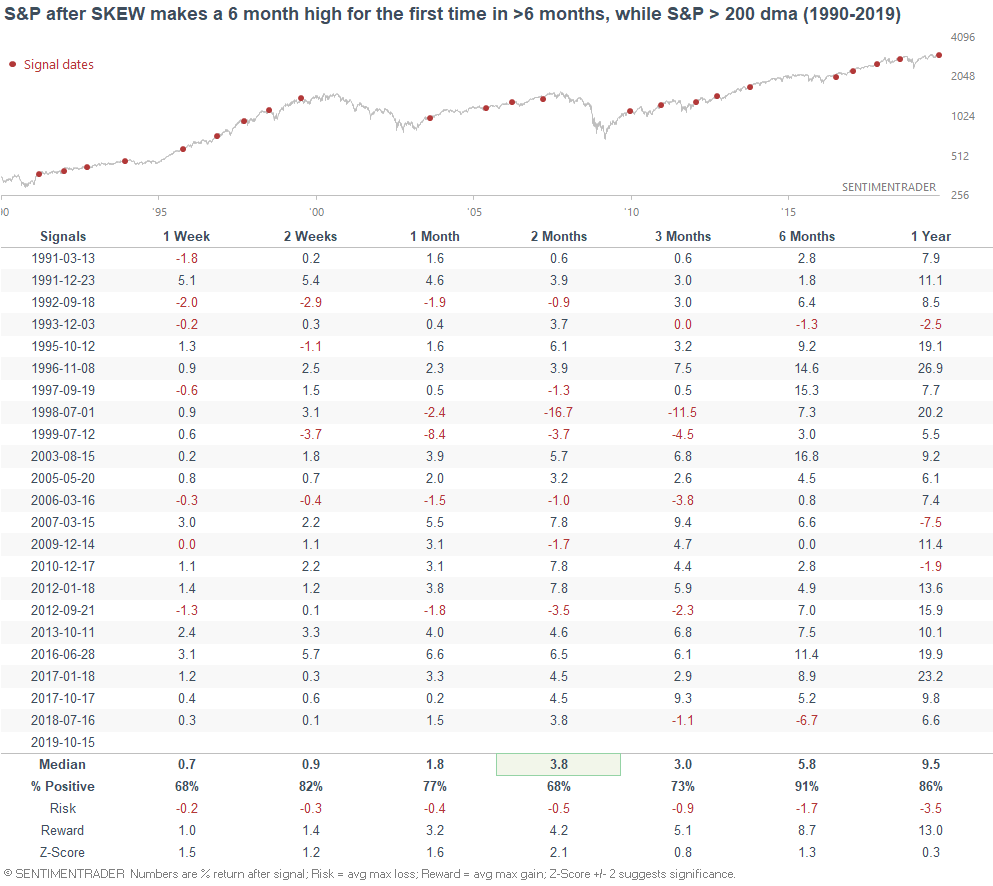
The S&P's returns over the next 2-4 weeks are mostly bullish.

Sorry, you don't have access to this report

Upgrade your subscription plan to get access
Go to Dasboard
PRODUCTS
SentimenTrader
Trading Tools
Indicators & Data API
‍
Strategies & Scanner
‍
Research Reports
FREE
RESOUrCES
Simple Backtest
Calculator
Simple Seasonality
Calculator
The Kelly Criterion
Calculator
Sentiment Geo Map
‍
Public Research Reports
‍
Pricing
Bundle pricing
‍
Announcements
‍
FAQ
COMPANY
‍
About
‍
In the News
‍
Testimonials
‍
Client Success Stories
CONTACT
‍
General Inquiries
‍
Media Inquiries
‍
Financial Professionals Inquiries
‍
© 2025 Sundial Capital Research Inc. All rights reserved.
Setsail Marketing
TermsPrivacyAffiliate Program
Risk Disclosure: Futures and forex trading contains substantial risk and is not for every investor. An investor could potentially lose all or more than the initial investment. Risk capital is money that can be lost without jeopardizing ones’ financial security or life style. Only risk capital should be used for trading and only those with sufficient risk capital should consider trading. Past performance is not necessarily indicative of future results.

Hypothetical Performance Disclosure: Hypothetical performance results have many inherent limitations, some of which are described below. No representation is being made that any account will or is likely to achieve profits or losses similar to those shown; in fact, there are frequently sharp differences between hypothetical performance results and the actual results subsequently achieved by any particular trading program. One of the limitations of hypothetical performance results is that they are generally prepared with the benefit of hindsight. In addition, hypothetical trading does not involve financial risk, and no hypothetical trading record can completely account for the impact of financial risk of actual trading. for example, the ability to withstand losses or to adhere to a particular trading program in spite of trading losses are material points which can also adversely affect actual trading results. There are numerous other factors related to the markets in general or to the implementation of any specific trading program which cannot be fully accounted for in the preparation of hypothetical performance results and all which can adversely affect trading results.

Testimonial Disclosure: Testimonials appearing on this website may not be representative of other clients or customers and is not a guarantee of future performance or success.