What I'm looking at - valuations, Optix, 2 week crash, volatility
Here's what I'm looking at:
Valuations
I'm not a big fan of putting all your eggs in one basket. The issue with diversification among asset classes is that correlation can go to 1 during market panics. That's why I prefer to diversify among strategies instead of diversifying among assets. I diversify between trading, public market investing, and private market investing strategies.
Is now the right time to go long from a public market investing perspective?
My investment portfolio was mostly long short-term bonds (a placeholder for cash) going into this crash. The reason was simple. Valuations were high. While valuations don't matter much on a multi-month or even 1-2 year perspective, they matter significantly on a 5-10 year time frame. Valuations matter because the inverse of valuations is the earnings yield. Earnings yields and similar concepts in private markets matter because earnings determine the long term return of an asset. After all, the main point of running a company (in the case of private businesses) or operating a portfolio of real estate is to make money. People aren't doing this for their entertainment.
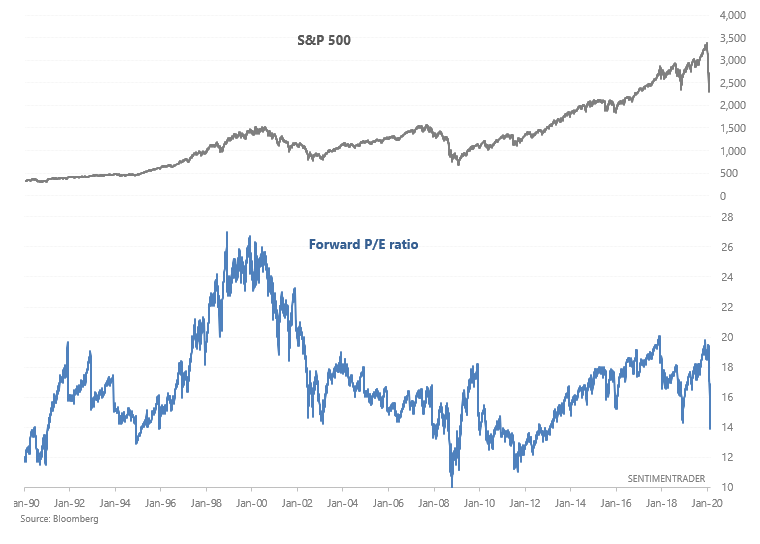
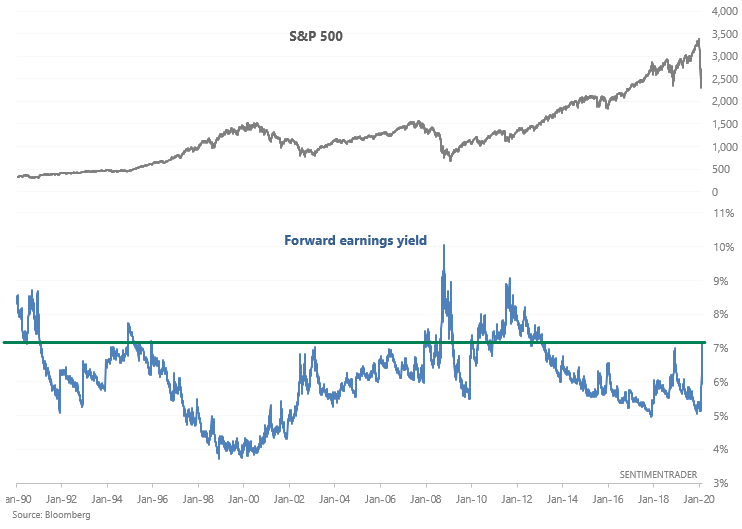
I haven't bought much stocks yet in my investing portfolio and still have the vast majority of my holdings in cash or cash-like instruments such as short term Treasury bond ETFs. The S&P 500's forward earnings yield has improved significantly from where it was before this crash. HOWEVER, it still isn't as attractive as I would like it to be. If stocks are to return a long term average of 10% per year (not adjusted for inflation, including dividends), I would like the forward earnings yield to reach at least 8% before I start to buy heavily.
From a medium term contrarian point of view, today is very much "just like 2008 or 1987 or 1929". A sharp bounce is to be expected. But from a long term investing point of view, today IS NOT like October 2008.
October 2008 saw valuations crash. Moreover, the recession was already in full swing and the bankruptcies were rampant in October 2008. Today, the recession has just started and bankruptcies have yet to soar. Perhaps the government's actions today can avoid such a terrible outcome. I don't have an opinion and nor do I have a crystal ball on the effectiveness of government actions, but I will say one thing.
Be ready.
If things continue to crash, there will be fantastic opportunities in public and private markets for people with cash. If you're an investor, stop acting like a trader and ignore the nonstop noise in the media/social media. If you're a trader, none of what I just said matters. This crash has been epic, and a sharp bounce is to be expected (even if the markets fall more in the future).
Average sentiment
Sentiment, as you guessed it, is extreme. I calculated a 20 day average for 9 countries' Optix (besides the U.S.), and then took an average of those 9 figures:
*Australia, Brazil, Canada, France, Germany, Italy, Japan, Mexico, UK
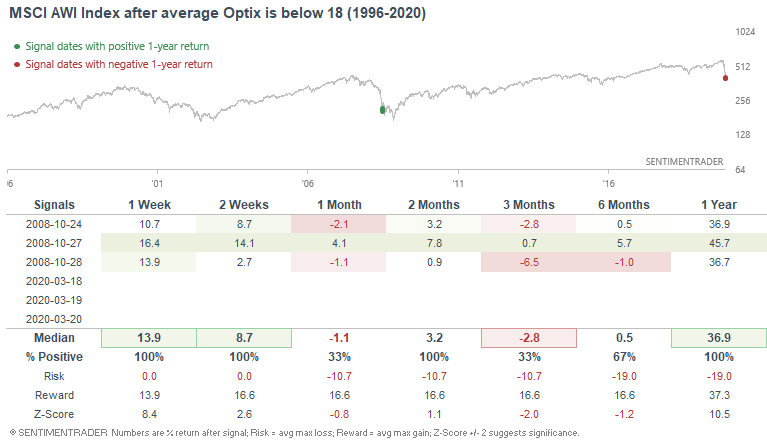
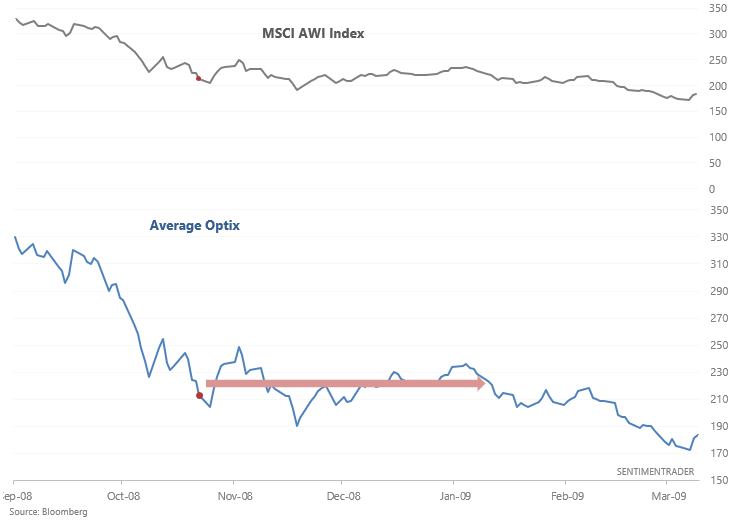
Average Optix is now at 17.1, even lower than its lowest point in 2008 (17.5)
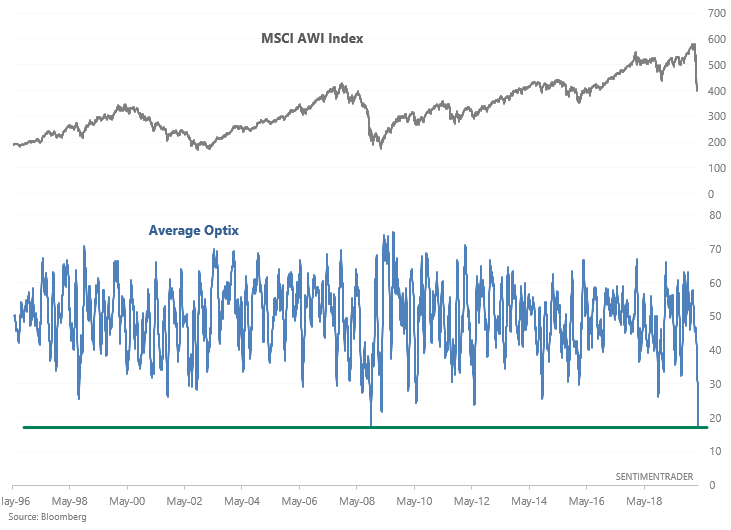
The MSCI AWI Index was extremely choppy over the next few months before the bear market ended:
Historic crash
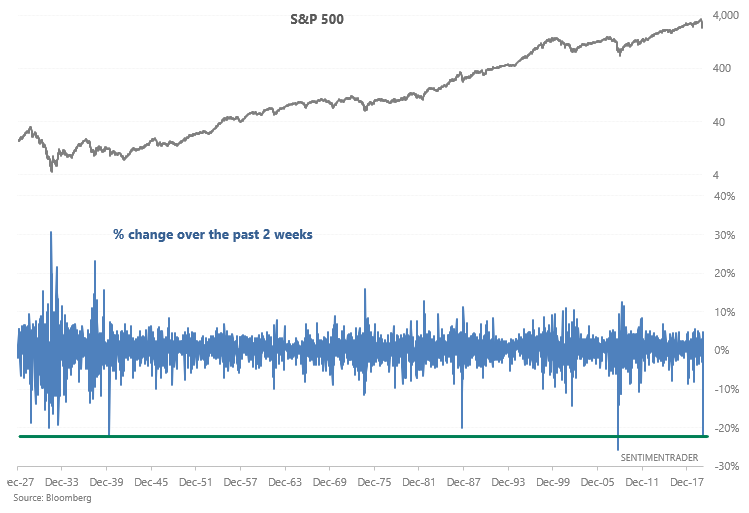
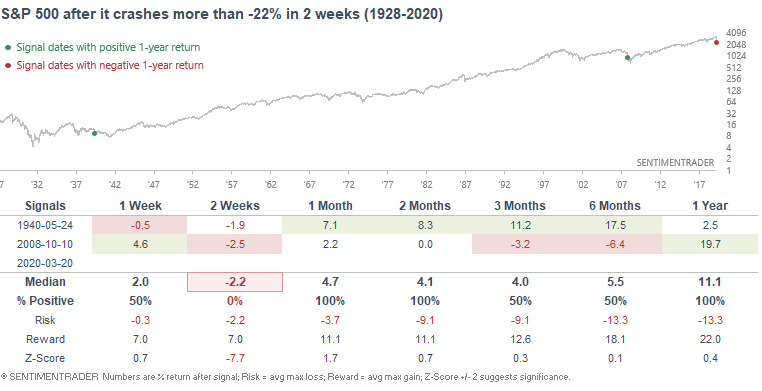
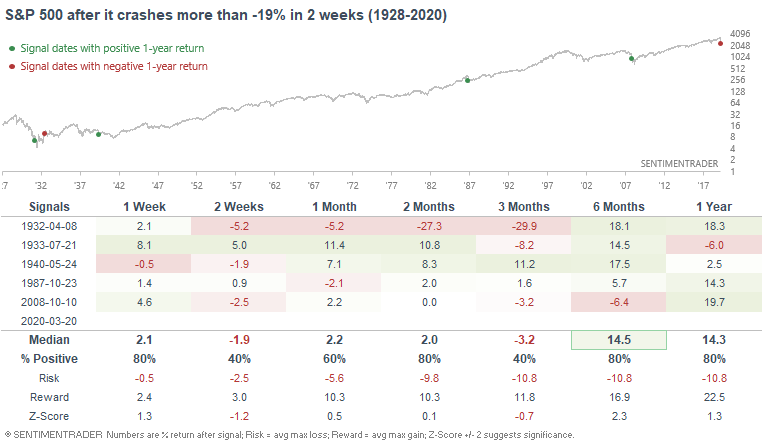
The S&P 500 crashed more than -22% over the past 2 weeks, one of the worst 2 week crashes on record:
The only historical cases that could watch this were in 2008 and 1940:
If we loosen the parameters, we can include a few more historical cases. Once again, the conclusion is "guessing the short term bottom is difficult since extremes can become even more extreme, but a rally over the next few months is to be expected".
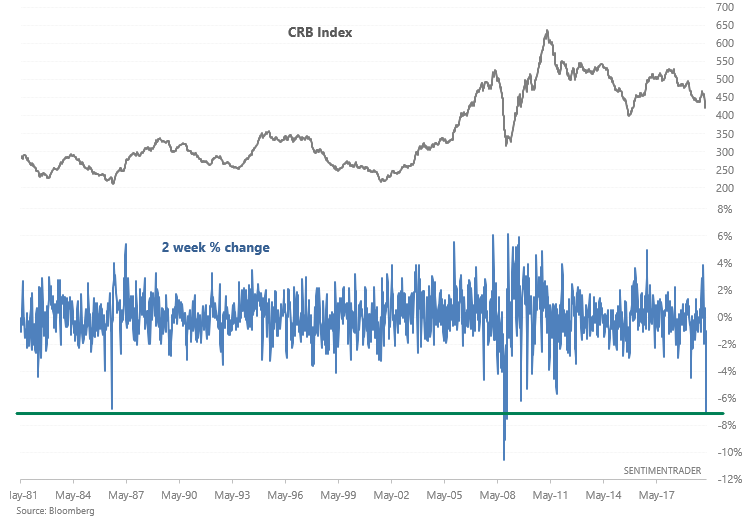
Similarly, this is one of the worst 2 week crashes for commodities (CRB Index):
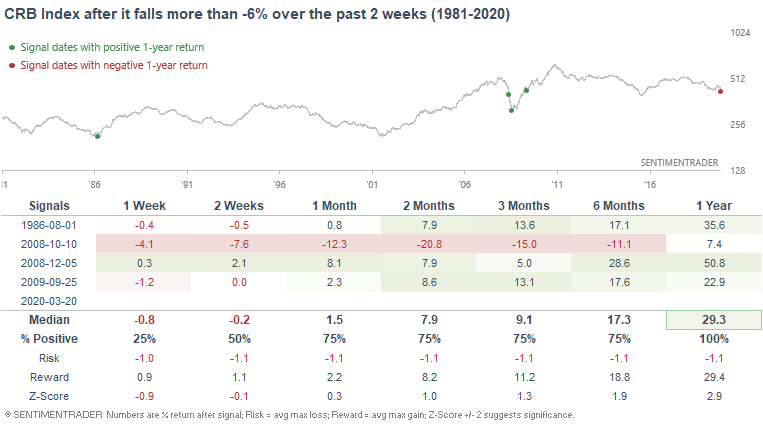
The few historical cases saw the CRB Index rally significantly over the next year:
Volatility
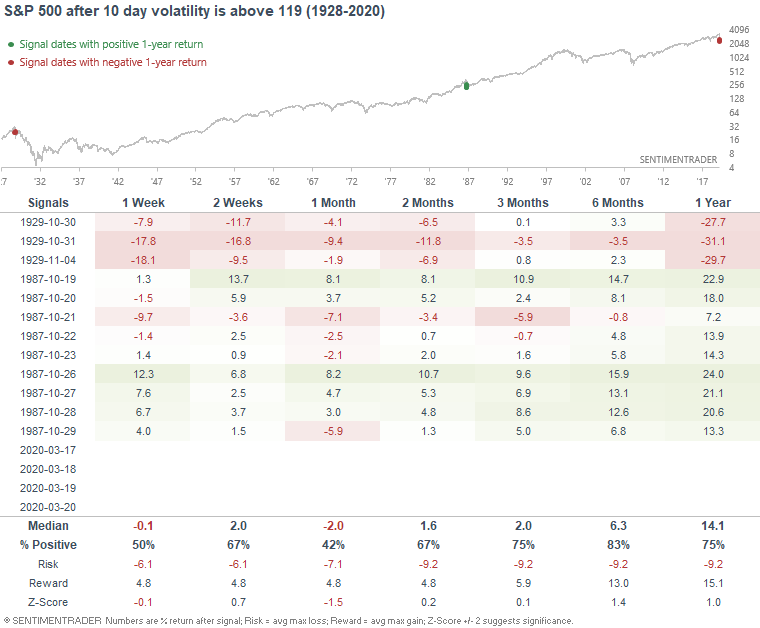
And lastly, the S&P 500's 10 day volatility is at one of the highest levels in history, matched only by the start of the 1929 crash and 1987 crash:
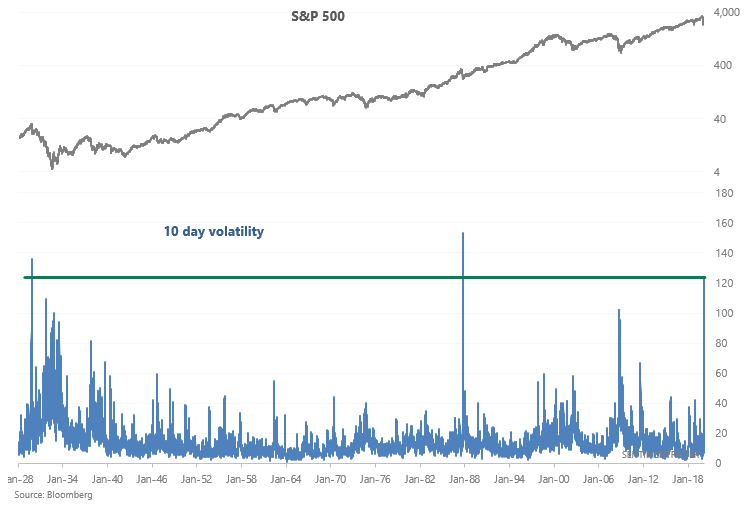
Here's what the S&P 500 did next: