Products
SentimenTrader Trading Tools
‍
Backtest Engine
My Trading Toolkit
Correlation Analysis
Seasonality
Indicators & Data API
‍
Proprietary Indicators & Charts
Market Data API
Strategies & Scanner
‍
50+ Trading Strategies
Smart Stock Scanner
Research Reports
‍
Research Solutions
Reports Library
Free Resources
Simple Backtest Calculator
Simple Seasonality Calculator
The Kelly Criterion Calculator
Sentiment Geo Map
Public Research Reports
Pricing
Company
About
In the News
Testimonials
Client Success Stories
Contact
Log inLoginSign up
< BACK TO ALL REPORTS

What I'm looking at - tech vs. finance, volatility of volatility, high yield, corporate earnings

Troy Bombardia
2020-01-13

Here's what I'm looking at:


Tech vs finance

As the stock market's rally rages on, the tech sector has surged relative to other sectors such as finance. (As interesting reads, see the WSJ's take on how big tech is moving into finance and Bloomberg's take on how Wall Street is being changed by machines/tech).

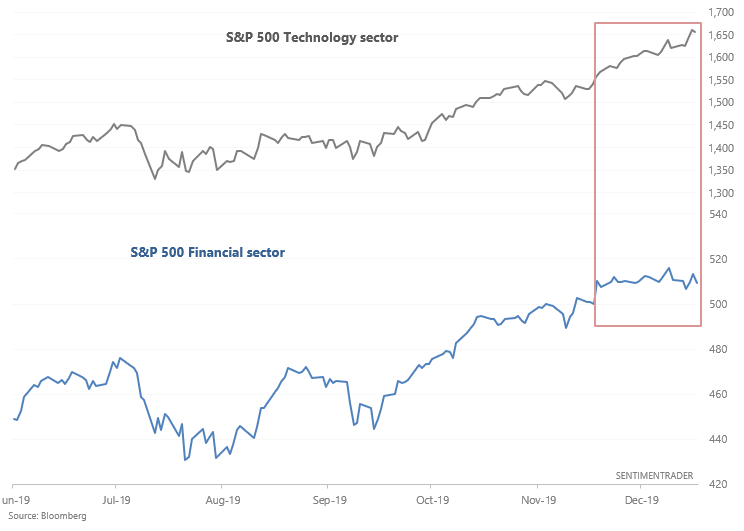
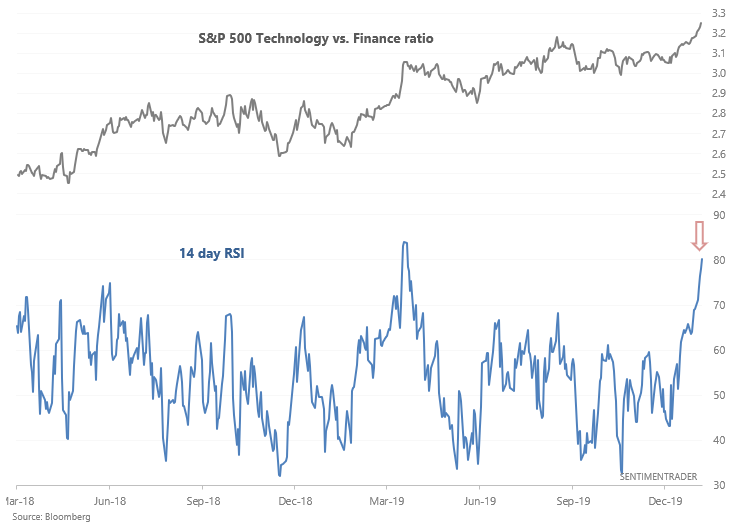
Regardless of why tech stocks are massively outperforming finance stocks, the S&P 500 Technology vs. Finance ratio has surged, pushing its RSI above 80.

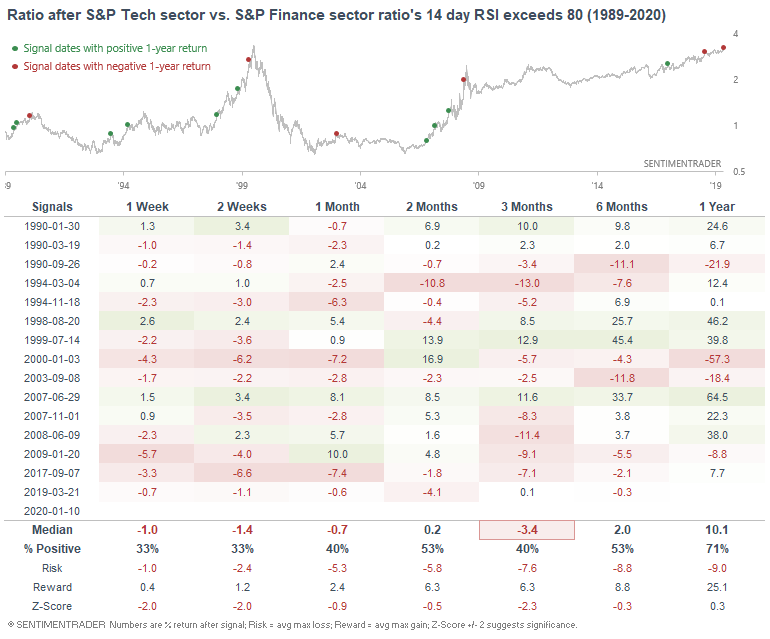
When tech outperformed finance significantly in the past, the S&P's returns over the next 1-2 months were often weak:

And tech often underperformed finance over the next few weeks and months.


Volatility of volatility

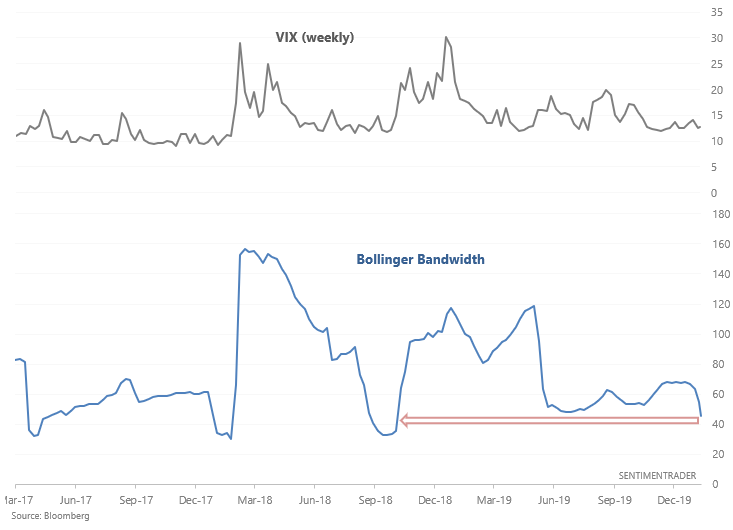
As we begin another week of low volatility, VIX's weekly Bollinger Bandwidth has fallen to the lowest level since Q4 2018, when stocks tanked and volatility exploded. Low volatility remains a short term bearish factor for the U.S. stock market right now.

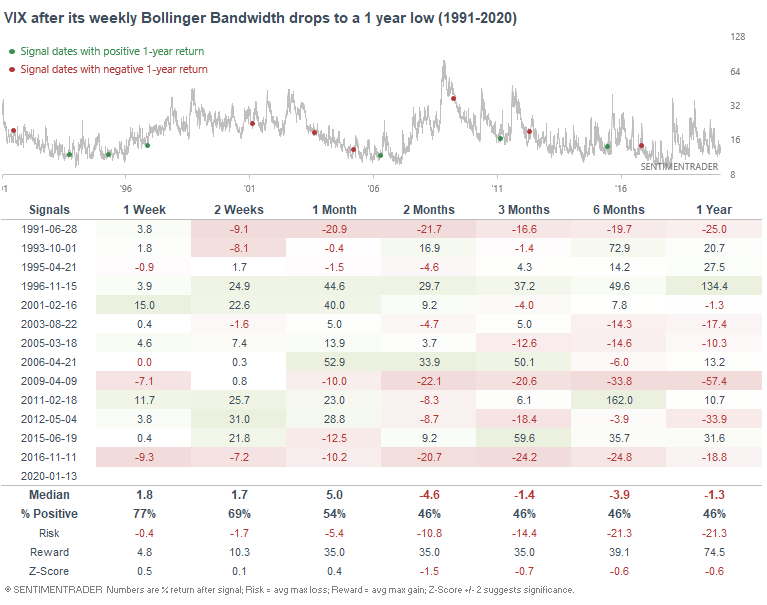
When this happened in the past, VIX had a tendency to jump over the next 1-2 weeks, particularly over the past 15 years:

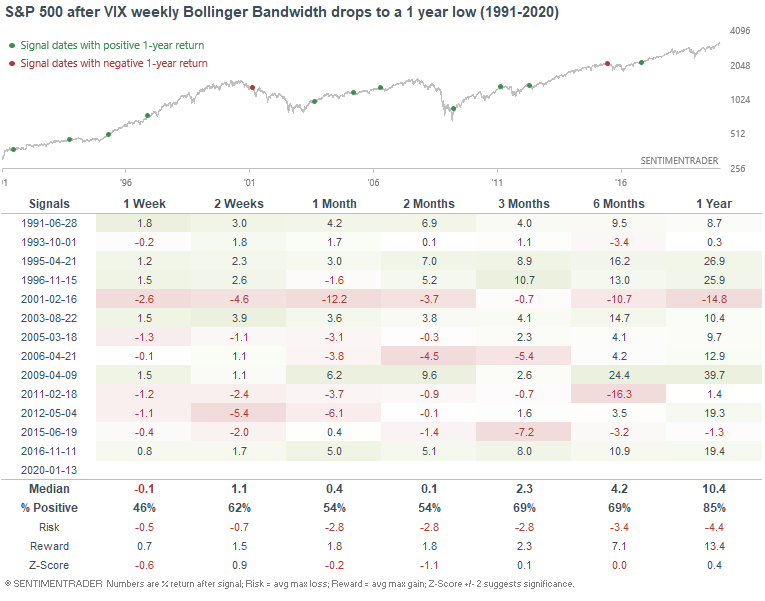
As a result, the S&P's returns up to 2 months later were worse-than-random.


High yield

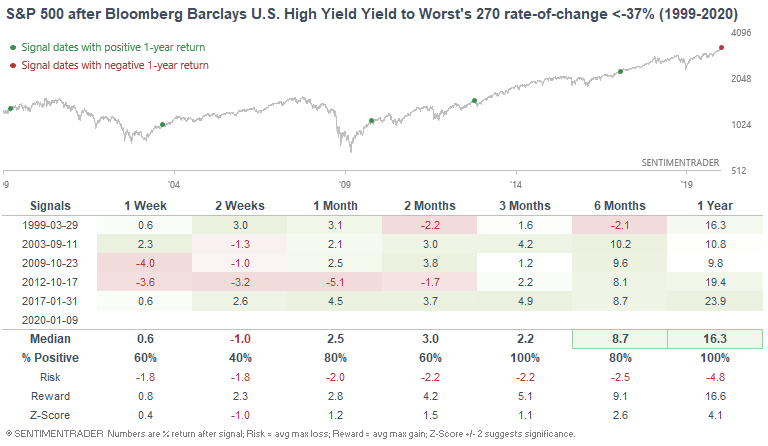
As Lisa Abramowicz tweeted, yields on junk bonds have fallen significantly over the past 13 months (see the Bloomberg Barclays U.S. High Yield Yield to Worst index):

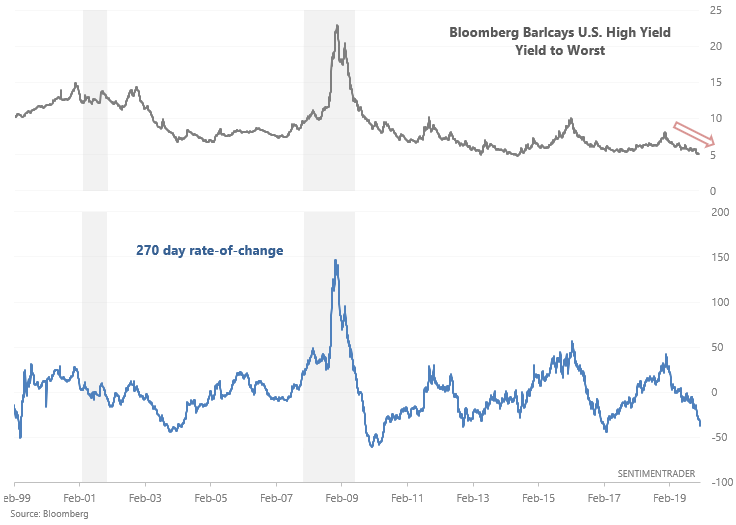
Junk bonds tend to face trouble before bear markets and recessions begin. So the downtrend in these yields is a long term bullish sign for stocks. When the index's 270 day rate-of-change fell below -37% in the past, the S&P's returns over the next 6-12 months were often strong:


Corporate earnings

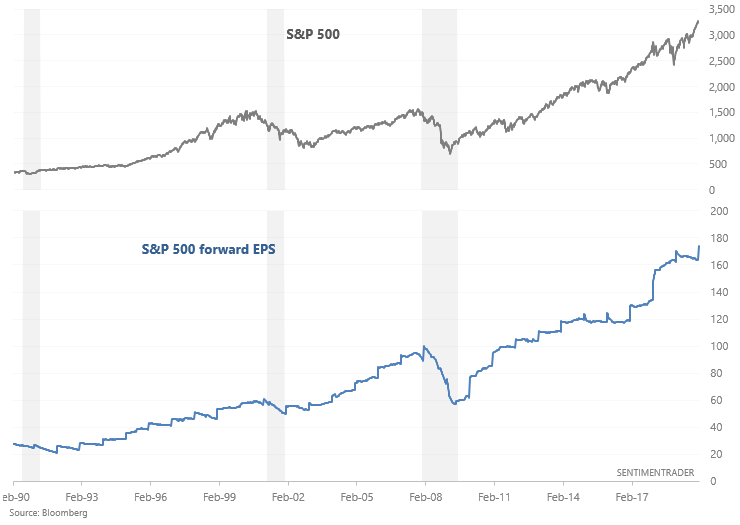
And lastly, the stock market and corporate earnings usually move in the same direction in the long term. The WSJ noted that after a lackluster 2019, corporate earnings are expected to grow in 2020. If this is indeed the case, then it's a positive factor for stocks on a 6-12 month forward basis.

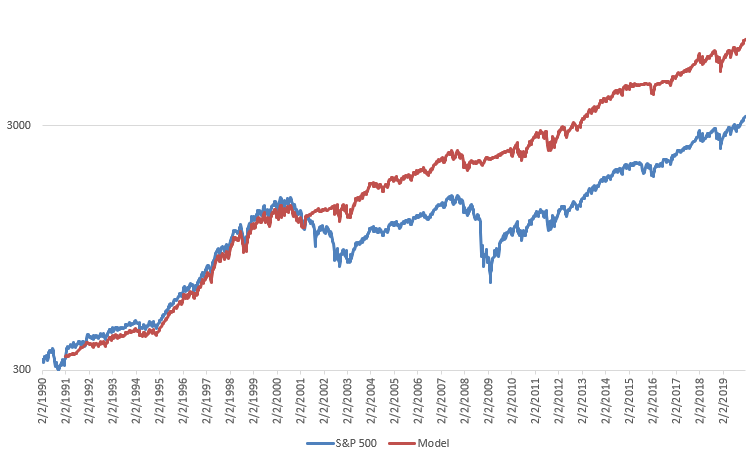
Last August I demonstrated that it's better to go long the S&P 500 when earnings are expected to trend higher and sell stocks when earnings are expected to trend lower.

The strategy = buy the S&P 500 when the S&P 500 forward EPS' 52 week average is going up. Otherwise, shift into the Bloomberg Barclays US Aggregate Bond Index 

 Right now, the S&P 500's forward earnings are expected to increase:


My trading portfolio

My trading portfolio is allocated 50% in the Macro Index Model and 50% in the Simple Trading Model With Fundamentals. At the moment I have instituted a discretionary override and gone 100% long bonds (instead of long stocks) due to the extreme nature of many of our core indicators, even though some of these core indicators aren't in the models.

Performance YTD 2020:

  1. My trading account is up 0.26%
  2. Currently 100% in bonds

Sorry, you don't have access to this report

Upgrade your subscription plan to get access
Go to Dasboard
PRODUCTS
SentimenTrader
Trading Tools
Indicators & Data API
‍
Strategies & Scanner
‍
Research Reports
FREE
RESOUrCES
Simple Backtest
Calculator
Simple Seasonality
Calculator
The Kelly Criterion
Calculator
Sentiment Geo Map
‍
Public Research Reports
‍
Pricing
Bundle pricing
‍
Announcements
‍
FAQ
COMPANY
‍
About
‍
In the News
‍
Testimonials
‍
Client Success Stories
CONTACT
‍
General Inquiries
‍
Media Inquiries
‍
Financial Professionals Inquiries
‍
© 2025 Sundial Capital Research Inc. All rights reserved.
Setsail Marketing
TermsPrivacyAffiliate Program
Risk Disclosure: Futures and forex trading contains substantial risk and is not for every investor. An investor could potentially lose all or more than the initial investment. Risk capital is money that can be lost without jeopardizing ones’ financial security or life style. Only risk capital should be used for trading and only those with sufficient risk capital should consider trading. Past performance is not necessarily indicative of future results.

Hypothetical Performance Disclosure: Hypothetical performance results have many inherent limitations, some of which are described below. No representation is being made that any account will or is likely to achieve profits or losses similar to those shown; in fact, there are frequently sharp differences between hypothetical performance results and the actual results subsequently achieved by any particular trading program. One of the limitations of hypothetical performance results is that they are generally prepared with the benefit of hindsight. In addition, hypothetical trading does not involve financial risk, and no hypothetical trading record can completely account for the impact of financial risk of actual trading. for example, the ability to withstand losses or to adhere to a particular trading program in spite of trading losses are material points which can also adversely affect actual trading results. There are numerous other factors related to the markets in general or to the implementation of any specific trading program which cannot be fully accounted for in the preparation of hypothetical performance results and all which can adversely affect trading results.

Testimonial Disclosure: Testimonials appearing on this website may not be representative of other clients or customers and is not a guarantee of future performance or success.